
JVM coredump分析系列(2):使用Arthas抓取火焰图导致的crash分析原创
JvmtiExport::post_compiled_method_load 导致的 crash
前一段时间,有用户反映使用 Arthas 抓取火焰图后 JVM 进程经常会出现 crash 导致进程挂掉,他们crash后的 hs_err_<pid>.log 文件(hs_err_<pid>.log 文件为 JVM 虚拟机记录致命错误的日志,文件默认生成在启动目录下,也可以通过 -XX:ErrorFile=/var/log/java/java_error%p.log 的命令来配置路径)显示如下:
# A fatal error has been detected by the Java Runtime Environment:
#
#  SIGSEGV (0xb) at pc=0x00007f4d2c8b9130, pid=1131915, tid=0x00007f4d72743700
  ......
# Core dump written. Default location: /opt/core or core.1131915
  ......
Stack: [0x00007f9541147000,0x00007f9541248000],  sp=0x00007f9541246b48,  free space=1022k
Native frames: (J=compiled Java code, j=interpreted, Vv=VM code, C=native code)
V  [libjvm.so+0x821193]  JvmtiExport::post_compiled_method_load(nmethod*)+0xdb
V  [libjvm.so+0xbcf683]  JvmtiDeferredEvent::post()+0x9b3
V  [libjvm.so+0xbd013c]  ServiceThread::service_thread_entry(JavaThread*, Thread*)+0x31c
V  [libjvm.so+0x7c4f22]  JavaThread::thread_main_inner()+0x212
V  [libjvm.so+0x9b52d8]  java_start(Thread*)+0xf8
C  [libpthread.so.0+0x8f4b]
Arthas 等工具使用了JVMTI[1](全称 JVM Tool Interface,是 JVM 虚拟机所提供的 native 编程接口,提供了可用于 debug 和 profiler 的接口,包括但不限于:分析、调试、监控、线程分析和覆盖率工具等)来做监控、增强等功能,追究此处 crash 原因需要我们先梳理下堆栈处 JVMTI 相关的逻辑。
我们从堆栈处可以看到 ServiceThread 线程,在 JVM 中除了业务线程之外还会有一些虚拟机自己创建的线程,服务线程 ServiceThread 就是其中一种,我们通过 jstack pid 命令查看 JVM 进程线程堆栈的时候就可以看到其相关信息:
"Service Thread" #8 daemon prio=9 os_prio=0 tid=0x0000ffff9c0c6800 nid=0x6fe runnable [0x0000000000000000] java.lang.Thread.State: RUNNABLE
ServiceThread 线程会帮 JVM 进程做一些杂活如:内存检查等,其中 JVMTI 事件的发生也是由它处理的。大家都知道 Hotspot 会将热点方法 method 编译成本地方法 nmethod,即 native method(这也是 Hotspot 名称的由来),我们查看编译热点代码的方法 ciEnv::register_method 中的逻辑:
# src/share/vm/ci/ciEnv.cpp
void ciEnv::register_method(ciMethod* target,
                            int entry_bci,
                            CodeOffsets* offsets,
                            int orig_pc_offset,
                            CodeBuffer* code_buffer,
                            int frame_words,
                            OopMapSet* oop_map_set,
                            ExceptionHandlerTable* handler_table,
                            ImplicitExceptionTable* inc_table,
                            AbstractCompiler* compiler,
                            int comp_level,
                            bool has_unsafe_access,
                            bool has_wide_vectors,
                            RTMState  rtm_state) {
VM_ENTRY_MARK;
nmethod* nm = NULL;
{
    ......

    nm =  nmethod::new_nmethod(method,
                               compile_id(),
                               entry_bci,
                               offsets,
                               orig_pc_offset,
                               debug_info(), dependencies(), code_buffer,
                               frame_words, oop_map_set,
                               handler_table, inc_table,
                               compiler, comp_level);
    ......

    if (nm != NULL) {
        // JVMTI -- compiled method notification (must be done outside lock)
        nm->post_compiled_method_load_event();
    } else {
        // The CodeCache is full. Print out warning and disable compilation.
        record_failure("code cache is full");
        CompileBroker::handle_full_code_cache();
    }
}
可以发现如果 nmethod 编译成功,那么将会通过 nm->post_compiled_method_load_event(); 将对应的 compiled_method_load_event 事件(此事件表示 nmethod 已被编译加载,也是我们 crash 日志里面出错的事件类型)添加到一个名为 JvmtiDeferredEventQueue 的队列之中,代码逻辑如下:
# src/share/vm/code/nmethod.cpp

void nmethod::post_compiled_method_load_event() {
......
    if (JvmtiExport::should_post_compiled_method_load()) {
        // Let the Service thread (which is a real Java thread) post the event
        MutexLockerEx ml(Service_lock, Mutex::_no_safepoint_check_flag);
        JvmtiDeferredEventQueue::enqueue(
            JvmtiDeferredEvent::compiled_method_load_event(this));
    }
}
而 ServiceThread 线程则会一直在 while 循环中遍历 JvmtiDeferredEventQueue 队列是否有事件产生:
# src/share/vm/runtime/serviceThread.cpp
void ServiceThread::service_thread_entry(JavaThread* jt, TRAPS) {
    while (true) {
        ......
        {
            ......
            while (!(sensors_changed = LowMemoryDetector::has_pending_requests()) &&
                !(has_jvmti_events = JvmtiDeferredEventQueue::has_events()) &&
                !(has_gc_notification_event = GCNotifier::has_event()) &&
                !(has_dcmd_notification_event = DCmdFactory::has_pending_jmx_notification()) &&
                !(acs_notify = AllocationContextService::should_notify())) {
                    // wait until one of the sensors has pending requests, or there is a
                    // pending JVMTI event or JMX GC notification to post
                    Service_lock->wait(Mutex::_no_safepoint_check_flag);
            }

            if (has_jvmti_events) {
                // Get the event under the Service_lock
                jvmti_event = JvmtiDeferredEventQueue::dequeue();
                _jvmti_event = &jvmti_event;
            }

            if (has_jvmti_events) {
                _jvmti_event->post();
                _jvmti_event = NULL;  // reset
            }
        }
        ......
    }
}
我们可以发现如果队列中有事件产生(即JvmtiDeferredEventQueue::has_events()),ServiceThread 就会将事件出队(即JvmtiDeferredEventQueue::dequeue()),并将事件进行 post 发布以供外部的 JVMTI 客户端(或称为代理,即常说的 Agent)监听,外部的 JVMTI 客户端(Arthas 就是一种 JVMTI 客户端)监听到后可以做一些相应的增强处理,我们查看 post 的具体逻辑:
# src/share/vm/prims/jvmtiImpl.cpp
void JvmtiDeferredEvent::post() {
    assert(Thread::current()->is_service_thread(), "Service thread must post enqueued events");
    switch(_type) {
        case TYPE_COMPILED_METHOD_LOAD: {
            nmethod* nm = _event_data.compiled_method_load;
            JvmtiExport::post_compiled_method_load(nm);
            break;
        }
        case TYPE_COMPILED_METHOD_UNLOAD: {
            nmethod* nm = _event_data.compiled_method_unload.nm;
            JvmtiExport::post_compiled_method_unload(
            _event_data.compiled_method_unload.method_id,
            _event_data.compiled_method_unload.code_begin);
            // done with the deferred event so unlock the nmethod
            nmethodLocker::unlock_nmethod(nm);
            break;
        }
        ......
    }
}
此时我们就可以找到 hs_err_<pid>.log 文件中报错的那一行代码:JvmtiExport::post_compiled_method_load,结合我们 crash 的原因 SIGSEGV (0xb) at pc=0x00007fa2444251a0, pid=1723332, tid=0x00007fa2de684700(SIGSEGV:SIG 是信号名的通用前缀,SEGV 是 segmentation violation 存储器区段错误,此错误通常是由于程序访问了不属于它的内存空间造成的),所以我们有理由怀疑 JvmtiExport::post_compiled_method_load(nm); 中 post 的 nm,即 nmethod* nm = _event_data.compiled_method_load; 中取到的 nm 可能有问题,为了验证猜想,我们可以使用 GDB 去调试 JVM 进程 crash 时产生的 Coredump 文件。
Coredump 文件产生的路径写在了
hs_err_<pid>.log文件中:Core dump written. Default location: /opt/core or core.1723332,如果你发现此处显示# Failed to write core dump. Core dumps have been disabled. To enable core dumping, try "ulimit -c unlimited" before starting Java again,那么代表你运行 JVM 进程的用户限制了 Coredump 文件的产生,你可以使用ulimit -c来查看目前的限制文件大小,使用ulimit -c unlimited来放开相应的限制。
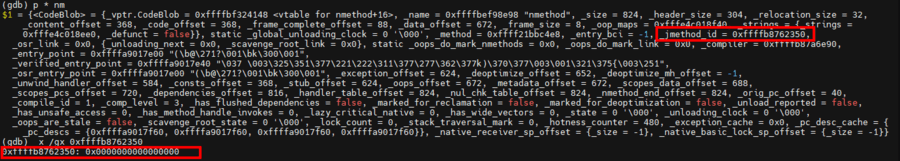
我们可以发现,0x0000000000000000 确实是个无效的地址,这意味着这个 nmethod 可能在被 post 之前就被卸载了(方法所属的类被卸载),我们遇到此类问题可以第一时间去 OpenJDK 上游社区的 JDK BUG SYSTEM[2] 快速检索此类问题是否已经被社区解决,以减少重复工作。
经过一番搜索,我们发现 JDK-8173361 : various crashes in JvmtiExport::post_compiled_method_load[3],遇到的问题与我们遇到的问题简直一模一样,也是由于 nmethod 在 post 前已经被 unload 卸载,GC 将其回收掉了,所以 nmethod->_jmethod_id 的内容为空进而引发了 SIGSEGV 的 crash,社区的 patch[4] 修复方式为:
-
将 nmethod 入队到 JvmtiDeferredEventQueue 前,通过 No_Safepoint_Verifier 与 Mutex::_no_safepoint_check_flag 防止 JavaThread 进入 safepoint 安全点; -
将 nmethod 入队到 JvmtiDeferredEventQueue 后,新增 oops_do 方法让 ServiceThread 遍历访问 JvmtiDeferredEventQueue,将 JvmtiDeferredEventQueue 作为 GC 的 Root。
当时 OpenJDK 上游社区只在 JDK14 当中修复了这个问题,并将其 backport 回合到了 JDK13.0.7、JDK13.0.6 与 JDK11.0.10 三个版本中,即当时 JDK8 中是依旧存在这个问题的,所以毕昇JDK发起了 backport 到 JDK8 的 patch,并成功将其回合到 OpenJDK 8u352 的版本中,如果你使用的 OpenJDK 版本大于等于 8u352,那么放心,你不会遇到此类问题。
JvmtiExport::post_compiled_method_unload 导致的 crash
用户升级到我们修复此问题的 JDK 版本之后,这个问题成功的消失了,当我以为已经完美闭环的时候,意外还是发生了。用户反映,之前 JvmtiExport::post_compiled_method_load 的 crash 消失了,但是进程跑一段时间又会出现一个新的 crash:
#
# A fatal error has been detected by the Java Runtime Environment:
#
#  SIGSEGV (0xb) at pc=0x00007fa2444251a0, pid=1723332, tid=0x00007fa2de684700
......
# C  0x00007fa2444251a0
......
siginfo: si_signo: 11 (SIGSEGV), si_code: 1 (SEGV_MAPERR), si_addr: 0x00007fa2444251a0

Registers:
RAX=0x00007fa2444251a0, RBX=0x00007fa3287a3090, RCX=0x00007fa346274818, RDX=0x00007fa3315819a0
......
Stack: [0x00007fa2de584000,0x00007fa2de685000],  sp=0x00007fa2de683c48,  free space=1023k
Native frames: (J=compiled Java code, j=interpreted, Vv=VM code, C=native code)
C  0x00007fa2444251a0
V  [libjvm.so+0x812481]  JvmtiDeferredEvent::post()+0xf1
V  [libjvm.so+0xa3e598]  ServiceThread::service_thread_entry(JavaThread*, Thread*)+0x398
V  [libjvm.so+0xaf3851]  JavaThread::thread_main_inner()+0xf1
V  [libjvm.so+0x99a888]  java_start(Thread*)+0xf8
C  [libpthread.so.0+0x7dc5]  start_thread+0xc5
......
我们观察 hs_err_<pid>.log 文件可以发现,这又是一个 SIGSEGV 问题,而且 pc 寄存器指向的地址 0x00007fa2444251a0 与 sig 信号中的 si_addr 的地址、RAX 寄存器中的地址相同,看上去大概率是 RAX 寄存器持有一个错误的值,然后直接 return 返回,导致 pc 寄存器跑飞从而 crash。
继续使用 GDB 调试新出现的 Coredump 文件,为了方便排查问题,我们可以挂载对应 JDK 版本的 debuginfo(debuginfo 可以传达有关程序或库的重要信息,包括将可执行代码映射回原始源代码的行表、文件名和包含的文件、程序中函数变量和类型的描述等等,可以供 debug 调试时使用,由于 debuginfo 文件比较大,一般 JDK 发行时都会将 debuginfo 相关文件去除以精简 JDK 的体积。OpenJDK 的 debuginfo 可以通过系统 yum install 安装,或者通过 rpm 文件手动安装如:redhat openjdk-debuginfo[5],如果无法安装请联系系统发行商或自行更换 yum 源;如果使用毕昇JDK,可以通过鲲鹏社区-毕昇JDK产品页[6]进行下载,使用方法请见 debuginfo 的使用指导[7];如果使用其他发行版 JDK,请自行联系相应 JDK 发行商获取),debuginfo 中保存着相应的 symbols 信息方便我们直接对应到出问题的代码位置,我们使用 bt 查看 crash 时的堆栈信息:
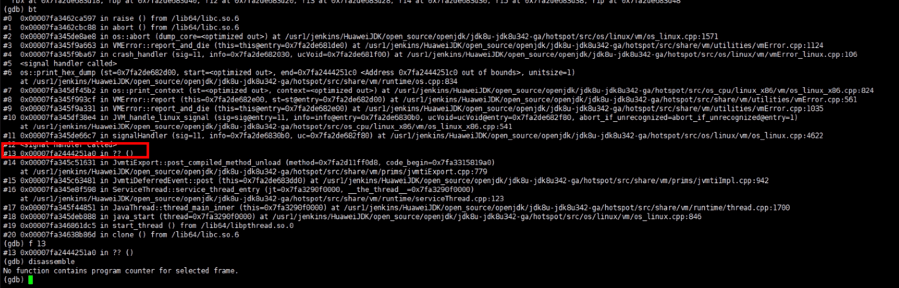
at /usr1/jenkins/HuaweiJDK/open source/openjdk/jdk8u-jdk8u342-ga/hotspot/src/share/wm/prims/jvmtiExport.cpp:779 ,查看对应的源码: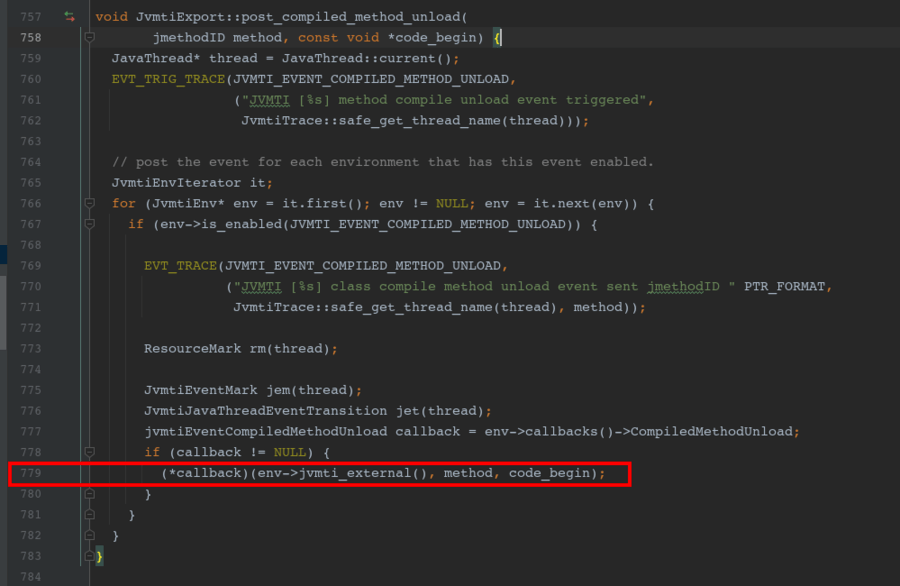
我们有很大理由怀疑,极有可能是此处的 callback 函数指针跑飞了,此处的 callback 是干什么的呢?我们上文中提到 ServiceThread 会将事件(compiled_method_load、compiled_method_unload 都属于事件)进行 post 发布以供外部的 JVMTI 客户端监听使用,此处的 callback 就是外部的 JVMTI 客户端注册的回调函数,外部的 JVMTI 客户端利用这个回调函数来执行自己相应的操作,即此处的 callback 指向的地址是由外部的 JVMTI 客户端控制的,我们继续调试:
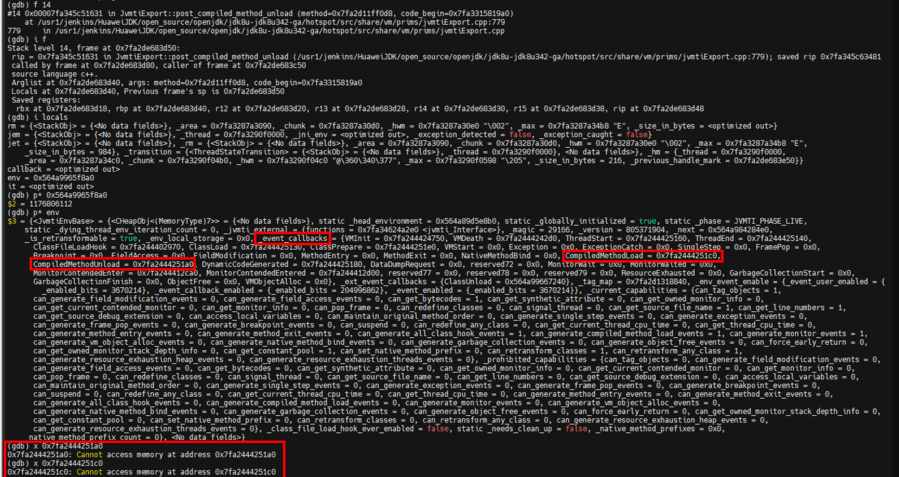
发现此时的 callback 的确是个无效的地址,很明显这不是一个 JVM 虚拟机自身 BUG 造成的问题,而是由外部 JVMTI客户端/JVMTI 工具引发的错误。由于用户当前加载了多个 Agent,有 Arthas、Vmtool、以及数个自己编写的 Agent,所以我们需要缩小排查的范围,上文中我们提到了如果 nmethod 编译成功,那么将会通过 nm->post_compiled_method_load_event() 将对应的 compiled_method_load_event 事件添加到一个名为 JvmtiDeferredEventQueue 的队列之中(unload 与 load 同理),其实此处展开来讲,JVM 是默认关闭入队 JvmtiDeferredEventQueue 的操作的(节省性能开销),查看相关逻辑(以 unload 为例):
# src/share/vm/code/nmethod.cpp
void nmethod::post_compiled_method_unload() {
    ......
    if (_jmethod_id != NULL && JvmtiExport::should_post_compiled_method_unload()) {
        ......
        if (SafepointSynchronize::is_at_safepoint()) {
            // Don't want to take the queueing lock. Add it as pending and
            // it will get enqueued later.
            JvmtiDeferredEventQueue::add_pending_event(event);
        } else {
            MutexLockerEx ml(Service_lock, Mutex::_no_safepoint_check_flag);
            JvmtiDeferredEventQueue::enqueue(event);
        }
    }
    ......
}
我们可以发现是否可以入队 JvmtiDeferredEventQueue 取决于 JvmtiExport::should_post_compiled_method_unload() 逻辑,而 JvmtiExport::should_post_compiled_method_unload() 取决于 JVMTI_SUPPORT_FLAG(should_post_compiled_method_unload),此变量如果未手动设置的话在 JVM 中是默认关闭的:
# src/share/vm/prims/jvmtiExport.cpp
bool              JvmtiExport::_should_post_compiled_method_unload        = false;
当然我们是可以手动将 JvmtiExport::_should_post_compiled_method_unload 值设为 true 来开启此功能的,追踪此处设置的逻辑:
# src/share/vm/prims/jvmtiEventController.cpp
static const jlong  COMPILED_METHOD_LOAD_BIT = (((jlong)1) << (JVMTI_EVENT_COMPILED_METHOD_LOAD - TOTAL_MIN_EVENT_TYPE_VAL));
static const jlong  COMPILED_METHOD_UNLOAD_BIT = (((jlong)1) << (JVMTI_EVENT_COMPILED_METHOD_UNLOAD - TOTAL_MIN_EVENT_TYPE_VAL));

JvmtiExport::set_should_post_compiled_method_load((any_env_thread_enabled & COMPILED_METHOD_LOAD_BIT) != 0);
JvmtiExport::set_should_post_compiled_method_unload((any_env_thread_enabled & COMPILED_METHOD_UNLOAD_BIT) != 0);
我们可以看到 JvmtiExport::_should_post_compiled_method_unload 值是由 JVMTI_EVENT_COMPILED_METHOD_UNLOAD 值来决定的,那 JVMTI_EVENT_COMPILED_METHOD_UNLOAD 又是由谁来决定的呢?继续追踪逻辑代码:
# hotspot/linux_aarch64_compiler2/generated/jvmtifiles/jvmtiEnter.cpp
// Check Event Capabilities
const bool JvmtiUtil::has_event_capability(jvmtiEvent event_type, const jvmtiCapabilities* capabilities_ptr) {
 switch (event_type) {
  ......
  case JVMTI_EVENT_COMPILED_METHOD_LOAD:
   return capabilities_ptr->can_generate_compiled_method_load_events != 0;
  case JVMTI_EVENT_COMPILED_METHOD_UNLOAD:
   return capabilities_ptr->can_generate_compiled_method_load_events != 0;
  ......
 }
 // if it does not have a capability it is required
 return JNI_TRUE;
}
发现所有变量的设置都来源于 jvmtiCapabilities,比较熟悉 JVMTI 的朋友看到这里可能就瞬间警觉起来,jvmtiCapabilities[8] 不就是在编写 JVMTI的客户端/Agent 时声明的,需要开启 JVMTI 相关能力的配置集嘛,我们查看 JVMTI 官方的相关介绍[9]也可以发现:
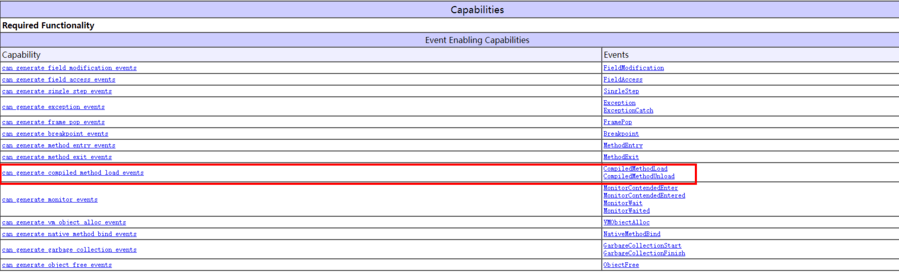
这是可以和我们的代码对得上的,这就意味着,只有在JVMTI的工具中将 can_generate_compiled_method_load_events 值设置为1,JVMTI 才会将 nmethod 的 load、unload 事件 post 给客户端的 callback 使用,所以我们只需要排查 JVMTI 工具中究竟是谁开启了 can_generate_compiled_method_load_events,就可以锁定相关的工具。
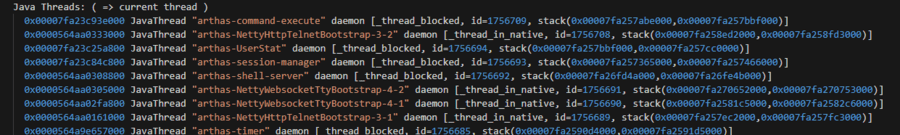
但是事情总没有想象中的那么简单,用户在排查了相关 Agent 的代码后发现,反映并未找到有 Agent 手动注册/开启了 can_generate_compiled_method_load_events,这很明显是讲不通的,我们查看了多个环境的 crash 日志,发现几乎每个日志都有一个共同点那就是都包含 Arthas 的线程,说明当时都在使用 Arthas:
用户此时使用的 Arthas 版本为 3.3.5,询问用户使用 Arthas 的用途,发现用户业务中使用了 Arthas 去定时抓取火焰图,查看 Arthas 使用火焰图的相关逻辑[10]:
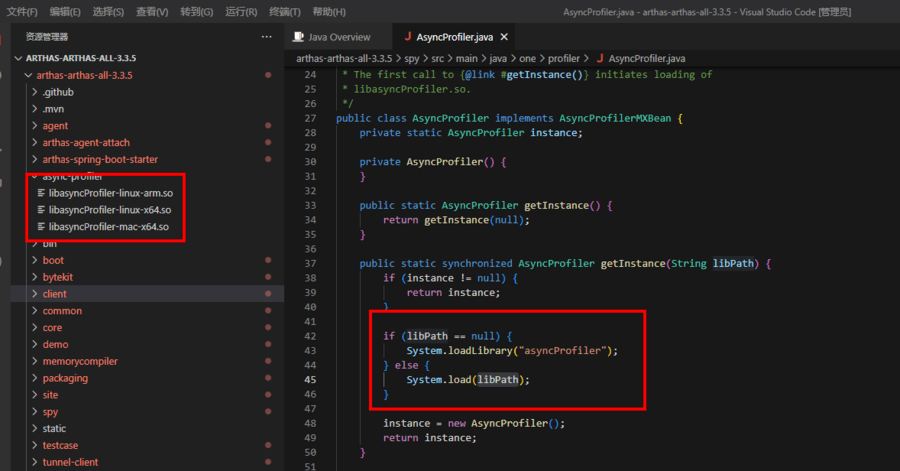
可以发现,此时 Arthas 是直接将业界火焰图工具 Async-Profiler 集成了进来,而 Async-Profiler 也是一种 JVMTI 工具,根据 Arthas 3.3.5 的历史提交记录:
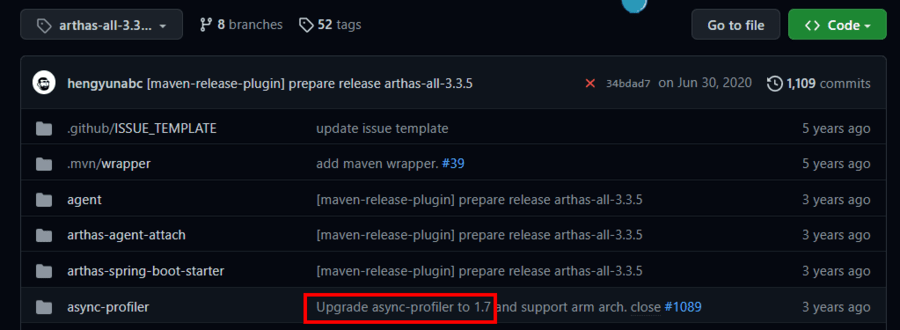
我们可以发现,此版本的 Arthas 集成的是 Async-Profiler 1.7 版本,去 GitHub 找到 Async-Profiler 1.7[11] 的源码,检索果然发现了 can_generate_compiled_method_load_events的使用[12]:
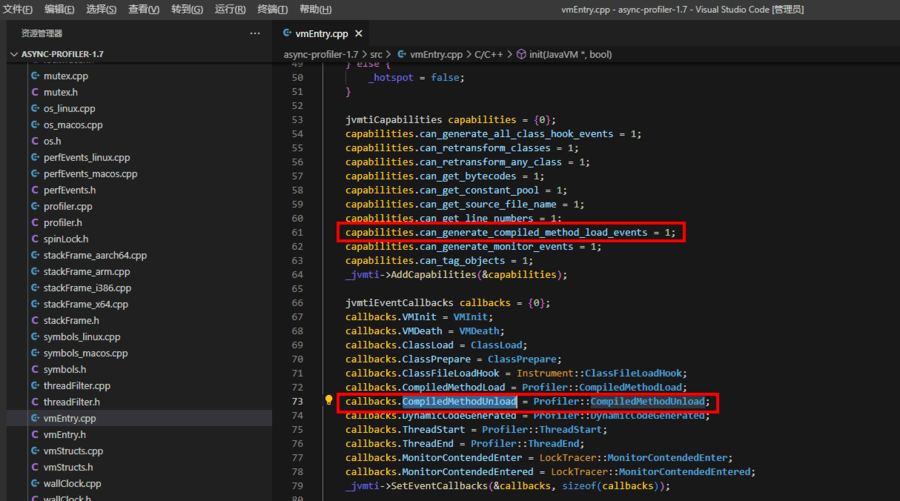
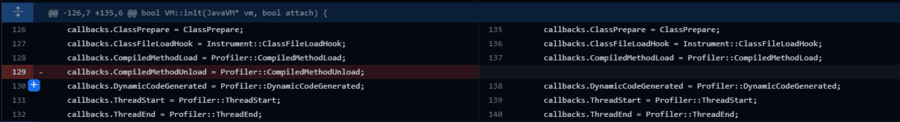
此时我们离真相就只有一步之遥了,我们基本可以断定是 Async-Profiler 1.7 中与 CompiledMethodUnload 相关的 callback 逻辑写出了问题,为了避免重复工作,我们优先查看 Async-Profiler 社区有没有修复这个错误,果然我们发现社区在 Async-Profiler 2.6 版本的 patch:Avoid JVM crashes related to CompiledMethodLoad bugs and stack walking during GC[13] 中修复了这个错误,当然这个 patch 比较大,除了修复 nmethod load 与 unload 的逻辑还修复了 CodeCache 相关的逻辑,查看 patch,其中关于 unload 的调用已被社区删除:
我们使用2.6版本 Async-Profiler 的动态库so替换 Arthas 中集成的1.7版本的 Async-Profiler 动态库后问题成功被解决,当然我们后来注意到 Arthas 社区也在 Arthas 3.5.6 版本中将 Async-Profiler 升级到了2.6版本:upgrade async-profiler to 2.6. #2089[14]。
-
所以如果你使用的 Arthas 版本<3.5.6,那么可以通过手动替换2.6及以上版本的 Async-Profiler 动态库即可; -
如果你使用的 Arthas 版本>=3.5.6,那么恭喜你,你不会遇到此类问题。
参考
-
https://docs.oracle.com/javase/8/docs/platform/jvmti/jvmti.html#whatIs
-
https://bugs.openjdk.org/secure/Dashboard.jspa
-
https://bugs.openjdk.org/browse/JDK-8173361
-
https://github.com/openjdk/jdk8u-dev/pull/9/files
-
https://rpmfind.net/linux/rpm2html/search.php?query=java-1.8.0-openjdk-debuginfo
-
https://www.hikunpeng.com/zh/developer/devkit/compiler/jdk
-
https://gitee.com/openeuler/bishengjdk-8/wikis/%E4%B8%AD%E6%96%87%E6%96%87%E6%A1%A3/debuginfo%E7%9A%84%E4%BD%BF%E7%94%A8%E6%8C%87%E5%AF%BC
-
https://docs.oracle.com/javase/8/docs/platform/jvmti/jvmti.html#capability
-
https://docs.oracle.com/javase/8/docs/platform/jvmti/jvmti.html#jvmtiCapabilities.can_generate_compiled_method_load_events
-
https://github.com/alibaba/arthas/blob/arthas-all-3.3.5/spy/src/main/java/one/profiler/AsyncProfiler.java
-
https://github.com/async-profiler/async-profiler/tree/v1.7
-
https://github.com/async-profiler/async-profiler/blob/v1.7/src/vmEntry.cpp#L61
-
https://github.com/async-profiler/async-profiler/commit/2d0b9c9921afa9eec809dac6991ecc03a240bcf7
-
https://github.com/alibaba/arthas/commit/8b726bae8f3f52f43f40f5ffc66a51727070abbe

Compiler SIG 专注于编译器领域技术交流探讨和分享,包括 GCC/LLVM/OpenJDK 以及其他的程序优化技术,聚集编译技术领域的学者、专家、学术等同行,共同推进编译相关技术的发展。
扫码添加 SIG 小助手微信,邀请你进 Compiler SIG 微信交流群。