
服务刚启动就 Old GC,要闹哪样?原创
背景
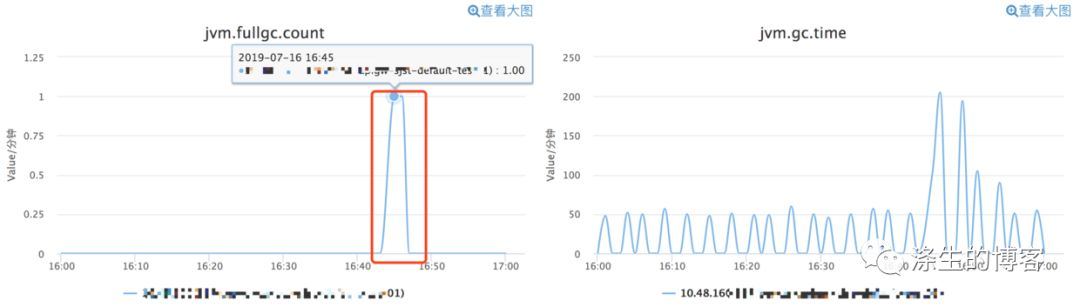
最近有个同学说他的服务刚启动就收到两次 Full GC 告警, 按道理来说刚启动,对象应该不会太多,为啥会触发 Full GC 呢?
带着疑问,我们还是先看看日志吧,毕竟日志的信息更多。
日志
可以看到,其实是两次 CMS GC(监控对 Full GC 和 Old GC 不分)。但是你会发现一个奇怪的现象,咦,“CMS-initial-mark: 0K(3222528K)” 怎么 Old Gen 对象使用空间大小为 0,细想服务刚启动,Old Gen 为 0 也算正常,但是为什么会触发CMS GC 呢?第一次 CMS GC 日志:
- 2019-07-16T16:44:56.270+0800: 8.446: [GC (CMS Initial Mark) [1 CMS-initial-mark: 0K(3222528K)] 1477124K(5152832K), 0.0445445 secs] [Times: user=0.16 sys=0.00, real=0.05 secs]
- 2019-07-16T16:44:56.315+0800: 8.490: [CMS-concurrent-mark-start]
- 2019-07-16T16:44:56.337+0800: 8.513: [CMS-concurrent-mark: 0.022/0.022 secs] [Times: user=0.03 sys=0.00, real=0.02 secs]
- 2019-07-16T16:44:56.337+0800: 8.513: [CMS-concurrent-preclean-start]
- 2019-07-16T16:44:56.343+0800: 8.518: [CMS-concurrent-preclean: 0.006/0.006 secs] [Times: user=0.00 sys=0.00, real=0.01 secs]
- 2019-07-16T16:44:56.343+0800: 8.518: [CMS-concurrent-abortable-preclean-start]
- CMS: abort preclean due to time 2019-07-16T16:45:01.469+0800: 13.644: [CMS-concurrent-abortable-preclean: 1.189/5.126 secs] [Times: user=4.76 sys=0.14, real=5.12 secs]
- 2019-07-16T16:45:01.469+0800: 13.645: [GC (CMS Final Remark) [YG occupancy: 389472 K (1930304 K)]13.645: [Rescan (parallel) , 0.0113744 secs]13.656: [weak refs processing, 0.0001506 secs]13.656: [class unloading, 0.0050100 secs]13.661: [scrub symbol table, 0.0027502 secs]13.664: [scrub string table, 0.0005121 secs][1 CMS-remark: 0K(3222528K)] 389472K(5152832K), 0.0210563 secs] [Times: user=0.07 sys=0.00, real=0.02 secs]
- 2019-07-16T16:45:01.490+0800: 13.666: [CMS-concurrent-sweep-start]
- CMS: Large Block: 0x00000006fb520000; Proximity: 0x0000000000000000 -> 0x00000006fb51fac8
- CMS: Large block 0x00000006fb520000
- 2019-07-16T16:45:01.490+0800: 13.666: [CMS-concurrent-sweep: 0.000/0.000 secs] [Times: user=0.00 sys=0.00, real=0.00 secs]
- 2019-07-16T16:45:01.490+0800: 13.666: [CMS-concurrent-reset-start]
- 2019-07-16T16:45:01.504+0800: 13.680: [CMS-concurrent-reset: 0.014/0.014 secs] [Times: user=0.02 sys=0.01, real=0.02 secs]
第二次 CMS GC 日志:
- 2019-07-16T16:45:37.496+0800: 49.672: [GC (CMS Initial Mark) [1 CMS-initial-mark: 0K(3222528K)] 1451537K(5152832K), 0.0575060 secs] [Times: user=0.22 sys=0.01, real=0.06 secs]
- 2019-07-16T16:45:37.554+0800: 49.730: [CMS-concurrent-mark-start]
- 2019-07-16T16:45:37.576+0800: 49.751: [CMS-concurrent-mark: 0.022/0.022 secs] [Times: user=0.03 sys=0.00, real=0.02 secs]
- 2019-07-16T16:45:37.576+0800: 49.752: [CMS-concurrent-preclean-start]
- 2019-07-16T16:45:37.582+0800: 49.758: [CMS-concurrent-preclean: 0.007/0.007 secs] [Times: user=0.01 sys=0.00, real=0.01 secs]
- 2019-07-16T16:45:37.582+0800: 49.758: [CMS-concurrent-abortable-preclean-start]
- CMS: abort preclean due to time 2019-07-16T16:45:42.639+0800: 54.814: [CMS-concurrent-abortable-preclean: 3.307/5.056 secs] [Times: user=4.63 sys=0.09, real=5.05 secs]
- 2019-07-16T16:45:42.639+0800: 54.815: [GC (CMS Final Remark) [YG occupancy: 1528656 K (1930304 K)]54.815: [Rescan (parallel) , 0.0710980 secs]54.886: [weak refs processing, 0.0003495 secs]54.887: [class unloading, 0.0158867 secs]54.903: [scrub symbol table, 0.0065509 secs]54.909: [scrub string table, 0.0008214 secs][1 CMS-remark: 0K(3222528K)] 1528656K(5152832K), 0.0980449 secs] [Times: user=0.30 sys=0.01, real=0.10 secs]
- 2019-07-16T16:45:42.738+0800: 54.913: [CMS-concurrent-sweep-start]
- CMS: Large Block: 0x00000006fb520000; Proximity: 0x00000006fb51fac8 -> 0x00000006fb51fac8
- CMS: Large block 0x00000006fb520000
- 2019-07-16T16:45:42.738+0800: 54.913: [CMS-concurrent-sweep: 0.000/0.000 secs] [Times: user=0.00 sys=0.00, real=0.00 secs]
- 2019-07-16T16:45:42.738+0800: 54.913: [CMS-concurrent-reset-start]
- 2019-07-16T16:45:42.745+0800: 54.921: [CMS-concurrent-reset: 0.007/0.007 secs] [Times: user=0.01 sys=0.00, real=0.01 secs]
之前我整理过一篇《JVM 源码解读之 CMS GC 触发条件》文章,其中提到很多种 CMS GC 触发条件,我们来一起来分析下吧。
3.分析
首先,这必然是 CMS 的 background collector。因为 foreground collector 触发条件比较简单,一般是遇到对象分配但空间不够,就会直接触发 GC。但是 Old Gen 占用为 0,不可能申请时空间不足。因此,可以断定是 CMS 的 background collector。另外, foreground collector 是没有 Precleaning、AbortablePreclean 阶段的,因此,从 CMS GC 日志上来看,也能看出是 background collector。
既然是 CMS background collector,我们结合 JVM 参数及日志,再按照 background collector 的五大种情况一个个的排除呗。
- -XX:+UseConcMarkSweepGC -XX:+UseParNewGC -Xms5114m -Xmx5114m -XX:MaxNewSize=1967m -XX:NewSize=1967m
- -XX:SurvivorRatio=22 -XX:PermSize=384m -XX:MaxPermSize=384m -Xss512k -XX:OldPLABSize=16
- -XX:+UseCMSCompactAtFullCollection -XX:+UseCMSInitiatingOccupancyOnly -XX:CMSFullGCsBeforeCompaction=0 -XX:CMSInitiatingOccupancyFraction=75
- -XX:InitialCodeCacheSize=128m -XX:+PrintClassHistogram -XX:PrintFLSStatistics=1 -XX:+PrintGC -XX:+PrintGCDateStamps -XX:+PrintGCDetails
- -XX:+PrintGCTimeStamps -XX:+PrintHeapAtGC -XX:+PrintPromotionFailure -XX:+PrintTenuringDistribution
- -XX:ReservedCodeCacheSize=128m -XX:+StartAttachListener -XX:+UseCompressedClassPointers
- -XX:+UseCompressedOops -XX:+DisableExplicitGC
-
根据是否是并行 Full GC
这种一般是由 System.gc 触发的 Full GC,且在配置了 ExplicitGCInvokesConcurrent 参数的情况下,进而将 Full GC 转成并行的 CMS GC。可以看到 JVM 配置并无此参数,而且还配置了 DisableExplicitGC 参数,它会屏蔽 System.gc。因此,排除这类情况。 -
根据统计数据动态计算(仅未配置 UseCMSInitiatingOccupancyOnly 时)
直接排除吧,因为 JVM 配置了 UseCMSInitiatingOccupancyOnly 参数。 -
根据 Old Gen 占用情况判断
这种情况主要是 Old Gen 空间使用占比情况与阈值比较,从 JVM 配置可以看到 CMSInitiatingOccupancyFraction=75 阈值设置的是 75%,目前 Old Gen 还是 0 呢,显然不符合。 -
根据增量 GC 是否可能会失败(悲观策略)
这种情况主要说的是在两代的 GC 体系中,如果 Young GC 已经失败或者可能会失败,JVM 就认为需要进行一次 CMS GC。我们看日志也知道,并无此类情况发生,而且 Old Gen 剩余空间还非常大,比整个 Young Gen 都大。 -
根据 metaspace 情况判断
这是最后一种情况了,这里主要看 metaspace 的 shouldconcurrentcollect 标志,这个标志在 metaspace 进行扩容前如果配置了 CMSClassUnloadingEnabled 参数时,会进行设置。
咋一看,JVM 参数貌似没设置这个参数呀,难道跟 metaspace 扩容无关。其实不然,CMSClassUnloadingEnabled 默认就是 true 呢。
- // Check again if the space is available. Another thread
- // may have similarly failed a metadata allocation and induced
- // a GC that freed space for the allocation.
- if (!MetadataAllocationFailALot) {
- _result = _loader_data->metaspace_non_null()->allocate(_size, _mdtype);
- }
- if (_result == NULL) {
- if (UseConcMarkSweepGC) {
- if (CMSClassUnloadingEnabled) {
- MetaspaceGC::set_should_concurrent_collect(true);
- }
- // For CMS expand since the collection is going to be concurrent.
- _result =
- _loader_data->metaspace_non_null()->expand_and_allocate(_size, _mdtype);
- }
其实日志中也是有蛛丝马迹的,只是不容易发现,以下是夹在 CMS GC 过程中的两段 Young GC 日志,可以看到日志中,metaspace 的 capacity 从 32762K 到 60333K,这也说明了,metaspace 在扩容。
Young GC 日志
第一次 Young GC 日志:
- {Heap before GC invocations=0 (full 1):
- par new generation total 1930304K, used 1846400K [0x0000000680600000, 0x00000006fb500000, 0x00000006fb500000)
- eden space 1846400K, 100% used [0x0000000680600000, 0x00000006f1120000, 0x00000006f1120000)
- from space 83904K, 0% used [0x00000006f1120000, 0x00000006f1120000, 0x00000006f6310000)
- to space 83904K, 0% used [0x00000006f6310000, 0x00000006f6310000, 0x00000006fb500000)
- concurrent mark-sweep generation total 3222528K, used 0K [0x00000006fb500000, 0x00000007c0000000, 0x00000007c0000000)
- Metaspace used 32159K, capacity 32762K, committed 33172K, reserved 1079296K
- class space used 3979K, capacity 4274K, committed 4312K, reserved 1048576K
- 2019-07-16T16:45:00.420+0800: 12.596: [GC (Allocation Failure)[ParNew
- Desired survivor size 42958848 bytes, new threshold 15 (max 15)
- - age 1: 36618400 bytes, 36618400 total
- : 1846400K->35858K(1930304K), 0.0408140 secs] 1846400K->35858K(5152832K)[Times: user=0.13 sys=0.02, real=0.05 secs]
- Heap after GC invocations=1 (full 1):
- par new generation total 1930304K, used 35858K [0x0000000680600000, 0x00000006fb500000, 0x00000006fb500000)
- eden space 1846400K, 0% used [0x0000000680600000, 0x0000000680600000, 0x00000006f1120000)
- from space 83904K, 42% used [0x00000006f6310000, 0x00000006f8614ac0, 0x00000006fb500000)
- to space 83904K, 0% used [0x00000006f1120000, 0x00000006f1120000, 0x00000006f6310000)
- concurrent mark-sweep generation total 3222528K, used 0K [0x00000006fb500000, 0x00000007c0000000, 0x00000007c0000000)
- Metaspace used 32159K, capacity 32762K, committed 33172K, reserved 1079296K
- class space used 3979K, capacity 4274K, committed 4312K, reserved 1048576K
- }
第二次 Young GC:
- {Heap before GC invocations=1 (full 2):
- par new generation total 1930304K, used 1882258K [0x0000000680600000, 0x00000006fb500000, 0x00000006fb500000)
- eden space 1846400K, 100% used [0x0000000680600000, 0x00000006f1120000, 0x00000006f1120000)
- from space 83904K, 42% used [0x00000006f6310000, 0x00000006f8614ac0, 0x00000006fb500000)
- to space 83904K, 0% used [0x00000006f1120000, 0x00000006f1120000, 0x00000006f6310000)
- concurrent mark-sweep generation total 3222528K, used 0K [0x00000006fb500000, 0x00000007c0000000, 0x00000007c0000000)
- Metaspace used 58703K, capacity 60333K, committed 60588K, reserved 1101824K
- class space used 7085K, capacity 7578K, committed 7664K, reserved 1048576K
- 2019-07-16T16:45:53.020+0800: 65.196: [GC (Allocation Failure)[ParNew
- Desired survivor size 42958848 bytes, new threshold 1 (max 15)
- - age 1: 62204096 bytes, 62204096 total
- - age 2: 13370728 bytes, 75574824 total
- : 1882258K->79755K(1930304K), 0.0500188 secs] 1882258K->79755K(5152832K)[Times: user=0.14 sys=0.01, real=0.05 secs]
- Heap after GC invocations=2 (full 2):
- par new generation total 1930304K, used 79755K [0x0000000680600000, 0x00000006fb500000, 0x00000006fb500000)
- eden space 1846400K, 0% used [0x0000000680600000, 0x0000000680600000, 0x00000006f1120000)
- from space 83904K, 95% used [0x00000006f1120000, 0x00000006f5f02d90, 0x00000006f6310000)
- to space 83904K, 0% used [0x00000006f6310000, 0x00000006f6310000, 0x00000006fb500000)
- concurrent mark-sweep generation total 3222528K, used 0K [0x00000006fb500000, 0x00000007c0000000, 0x00000007c0000000)
- Metaspace used 58703K, capacity 60333K, committed 60588K, reserved 1101824K
- class space used 7085K, capacity 7578K, committed 7664K, reserved 1048576K
- }
因此,这是一次因 Metaspace 扩容导致的 CMS GC。
解决
既然是 Metaspace 扩容导致的,我们应该避免这种情况发生。那怎么避免呢?指定个大小吧。
大家都知道 jdk8 Metaspace 替代了之前的 Perm Gen,Metaspace 的最大大小,也就是 MaxMetaspaceSize 默认基本是无穷大,也就是它会充分利用操作系统能提供的最大大小。
但是初始大小是多大呢?主要由 MetaspaceSize 参数控制,默认 20.8M 左右(x86 下开启 c2 模式),非常小,它控制 metaspaceGC 发生的初始阈值,也是最小阈值。
关于初始大小,有兴趣的可以计算下 (16*13/10)M = 20.8M。
- // Heap related flags
- define_pd_global(uintx,MetaspaceSize, ScaleForWordSize(16*M));
- #ifdef _LP64
- #define ScaleForWordSize(x) align_size_down_((x) * 13 / 10, HeapWordSize)
- #else
- #define ScaleForWordSize(x) (x)
- #endif
因此,最终设置下这两个参数大小,问题就解决啦。
- -XX:MetaspaceSize=256m -XX:MaxMetaspaceSize=256m
总结
在服务运行过程中,总会遇到奇奇怪怪得 GC 问题。关键是理清 GC 的脉络,做到成竹在胸,自然总能找到蛛丝马迹,从而定位并解决问题。另外,规范化 JVM 参数配置是避免诡异 GC 问题一个重要方法。