
PhantomReference导致CMS GC耗时严重原创
介绍
GC优化关键是找到优化的点,如果明确GC过程中耗时的阶段在哪里,优化起来应该也就不难了。这篇文章主要讲述最近一次CMS GC优化过程,是一次分享,也是一次总结。闲话少说,我们开始吧。
现象
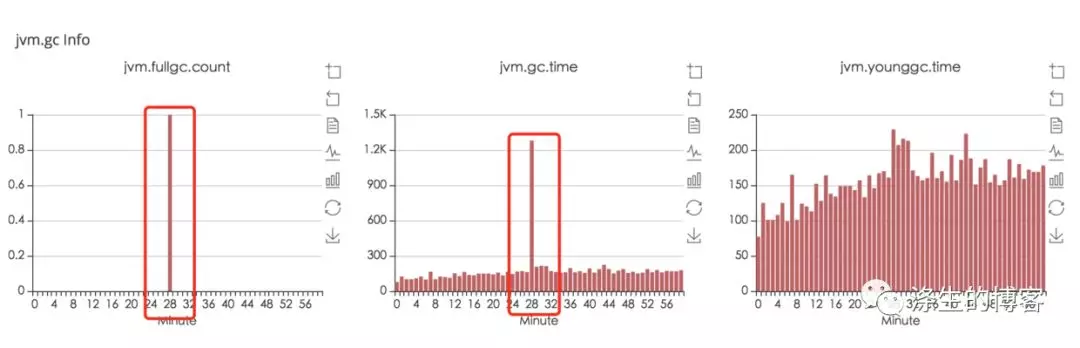
上图很明显(公司内部监控没有区分Old GC和Full GC)Old GC耗时严重,大致看了几天的监控,基本上每次都很耗时,时间约1s左右,这里统计的1s左右的耗时指的是stop-the-world的时间。
排查
那到底哪里耗时呢?我们得去看看GC日志,日志中有更多的信息
2018-01-13T19:21:36.254: [GC [1 CMS-initial-mark: 2097444K(4194304K)] 2143492K(6081792K), 0.2197240 secs] [Times: user=0.01 sys=0.17, real=0.22 secs]
2018-01-13T19:21:36.474: [CMS-concurrent-mark-start]
2018-01-13T19:21:36.654: [CMS-concurrent-mark: 0.180/0.180 secs] [Times: user=0.65 sys=0.07, real=0.18 secs]
2018-01-13T19:21:36.654: [CMS-concurrent-preclean-start]
2018-01-13T19:21:36.700: [CMS-concurrent-preclean: 0.045/0.045 secs] [Times: user=0.05 sys=0.01, real=0.04 secs]
2018-01-13T19:21:36.700: [CMS-concurrent-abortable-preclean-start]
CMS: abort preclean due to time 2018-01-13T19:21:41.765: [CMS-concurrent-abortable-preclean: 5.051/5.065 secs] [Times: user=7.08 sys=0.51, real=5.07 secs]
2018-01-13T19:21:41.768: [GC[YG occupancy: 503315 K (1887488 K)]2018-01-13T19:21:41.768: [Rescan (parallel) , 0.0975470 secs]
2018-01-13T19:21:41.866: [weak refs processing, 0.7034340 secs]
2018-01-13T19:21:42.569: [class unloading, 0.0152410 secs]
2018-01-13T19:21:42.585: [scrub symbol table, 0.0118450 secs]
2018-01-13T19:21:42.597: [scrub string table, 0.0021360 secs]
[1 CMS-remark: 2097444K(4194304K)] 2600759K(6081792K), 0.8884580 secs] [Times: user=1.17 sys=0.00, real=0.89 secs]
2018-01-13T19:21:42.657: [CMS-concurrent-sweep-start]
2018-01-13T19:21:44.283: [CMS-concurrent-sweep: 1.571/1.626 secs] [Times: user=2.77 sys=0.15, real=1.62 secs]
2018-01-13T19:21:44.284: [CMS-concurrent-reset-start]
2018-01-13T19:21:44.363: [CMS-concurrent-reset: 0.079/0.079 secs] [Times: user=0.04 sys=0.08, real=0.08 secs]
CMS GC日志比较详细,会打印各个阶段处理的详细信息。
这里我们重点关注两个stop-the-world的阶段CMS-initial-mark和CMS-remark。可以看到CMS-initial-mark耗时0.22s,CMS-remark耗时0.89s,所以主要是CMS-remark阶段比较耗时。remark阶段做的事情分好几块,具体是哪块耗时严重呢?
细看下CMS-remark阶段的日志,应该很快能发现weak refs processing处理比较耗时。
[weak refs processing, 0.7034340 secs
看到这里,大家一定很想知道weak refs processing是什么?
为什么处理这么耗时?
void ReferenceProcessor::process_discovered_references(
BoolObjectClosure* is_alive,
OopClosure* keep_alive,
VoidClosure* complete_gc,
AbstractRefProcTaskExecutor* task_executor) {
NOT_PRODUCT(verify_ok_to_handle_reflists());
assert(!enqueuing_is_done(), "If here enqueuing should not be complete");
// Stop treating discovered references specially.
disable_discovery();
bool trace_time = PrintGCDetails && PrintReferenceGC;
// Soft references
{
TraceTime tt("SoftReference", trace_time, false, gclog_or_tty);
process_discovered_reflist(_discoveredSoftRefs, _current_soft_ref_policy, true,
is_alive, keep_alive, complete_gc, task_executor);
}
update_soft_ref_master_clock();
// Weak references
{
TraceTime tt("WeakReference", trace_time, false, gclog_or_tty);
process_discovered_reflist(_discoveredWeakRefs, NULL, true,
is_alive, keep_alive, complete_gc, task_executor);
}
// Final references
{
TraceTime tt("FinalReference", trace_time, false, gclog_or_tty);
process_discovered_reflist(_discoveredFinalRefs, NULL, false,
is_alive, keep_alive, complete_gc, task_executor);
}
// Phantom references
{
TraceTime tt("PhantomReference", trace_time, false, gclog_or_tty);
process_discovered_reflist(_discoveredPhantomRefs, NULL, false,
is_alive, keep_alive, complete_gc, task_executor);
}
// Weak global JNI references. It would make more sense (semantically) to
// traverse these simultaneously with the regular weak references above, but
// that is not how the JDK1.2 specification is. See #4126360. Native code can
// thus use JNI weak references to circumvent the phantom references and
// resurrect a "post-mortem" object.
{
TraceTime tt("JNI Weak Reference", trace_time, false, gclog_or_tty);
if (task_executor != NULL) {
task_executor->set_single_threaded_mode();
}
process_phaseJNI(is_alive, keep_alive, complete_gc);
}
}
看JVM源码,weak refs processing主要包括SoftReference、WeakReference、FinalReference、PhantomReference以及JNI Weak Reference这五种Reference对象的处理,处理的主要内容是对之前标记的Reference对象重新处理,重新判断是否需要标记(不标记就是要回收的),如果不标记就需要放到refqueue里,等待java ReferenceHandler线程处理。
所以从工作的主要内容看各种Reference的处理时间跟reference的个数成正比。
那么接下来我们需要做的是确定是哪种Reference比较耗时,然后进行针对性优化。所以加了个参数-XX:+PrintReferenceGC,来具体显示各种Reference的个数和处理时间。
2018-01-30T08:30:08.188: [GC[YG occupancy: 254029 K (1887488 K)]
2018-01-30T08:30:08.188: [Rescan (parallel) , 0.0503640 secs]
2018-01-30T08:30:08.239: [weak refs processing
2018-01-30T08:30:08.239: [SoftReference, 4468 refs, 0.0006040 secs]
2018-01-30T08:30:08.239: [WeakReference, 286808 refs, 0.0336870 secs]
2018-01-30T08:30:08.273: [FinalReference, 35456 refs, 0.0271650 secs]
2018-01-30T08:30:08.300: [PhantomReference, 8041 refs, 3 refs, 0.4335280 secs]
2018-01-30T08:30:08.734: [JNI Weak Reference, 0.0000250 secs], 0.4951020 secs]
2018-01-30T08:30:08.734: [class unloading, 0.0143290 secs]
2018-01-30T08:30:08.748: [scrub symbol table, 0.0110140 secs]
2018-01-30T08:30:08.759: [scrub string table, 0.0015380 secs] [1 CMS-remark: 2098695K(4194304K)] 2352725K(6081792K), 0.6112680 secs] [Times: user=0.76 sys=0.00, real=0.61 secs]
从上面的日志就能很明显看出来是PhantomReference处理时间较长。
找到了优化的点,处理起来也就简单了。
解决
接下来我们需要做下面两件事。
1、确定PhantomReference的产生的原因,从源头控制;
2、通过JVM提供的参数,进行优化。
参数优化
我们先来做第二件事吧,因为它比较容易,JVM确实提供了相关的优化参数,通过-XX:+ParallelRefProcEnabled参数来并行处理Reference,加快处理速度,缩短耗时。
这里并行处理的线程数,是通过-XX:ParallelGCThreads参数来控制的,如果没有设置ParallelGCThreads默认跟cpu核数相关,是可以计算的
对应的JVM源码是
unsigned int Abstract_VM_Version::nof_parallel_worker_threads(
unsigned int num,
unsigned int den,
unsigned int switch_pt) {
if (FLAG_IS_DEFAULT(ParallelGCThreads)) {
assert(ParallelGCThreads == 0, "Default ParallelGCThreads is not 0");
unsigned int threads;
// For very large machines, there are diminishing returns
// for large numbers of worker threads. Instead of
// hogging the whole system, use a fraction of the workers for every
// processor after the first 8. For example, on a 72 cpu machine
// and a chosen fraction of 5/8
// use 8 + (72 - 8) * (5/8) == 48 worker threads.
unsigned int ncpus = (unsigned int) os::initial_active_processor_count();
threads = (ncpus <= switch_pt) ?
ncpus :
(switch_pt + ((ncpus - switch_pt) * num) / den);
#ifndef _LP64
// On 32-bit binaries the virtual address space available to the JVM
// is usually limited to 2-3 GB (depends on the platform).
// Do not use up address space with too many threads (stacks and per-thread
// data). Note that x86 apps running on Win64 have 2 stacks per thread.
// GC may more generally scale down threads by max heap size (etc), but the
// consequences of over-provisioning threads are higher on 32-bit JVMS,
// so add hard limit here:
threads = MIN2(threads, (2*switch_pt));
#endif
return threads;
} else {
return ParallelGCThreads;
}
简单根据源码翻译下就是
// ncpus是cpu的核数
if ( ncpus <= 8) {
return ncpus;
} else {
return 8 + (ncpus - 8) * 5 / 8;
}
设置-XX:+ParallelRefProcEnabled参数后效果也很明显
[PhantomReference, 6117 refs, 9 refs, 0.1351920 secs]
根源解决
要想从根源解决,我们必须找到PhantomReference产生的相关代码,这里一般存在两种方式:
1、简单通过jmap -histo [pid],找到相关的类。
这种方式比较轻量,对应用损伤较小,不过只能看到各个类的对象个数,总体占用空间大小,看不到很多详细信息。
2、jmap -dump:format=b,file=dumpFileName [pid],拿到堆的dump文件,然后通过mat分析。
这种方式比较重,dump时间一般很长,需要先摘除机器流量,然后进行操作。
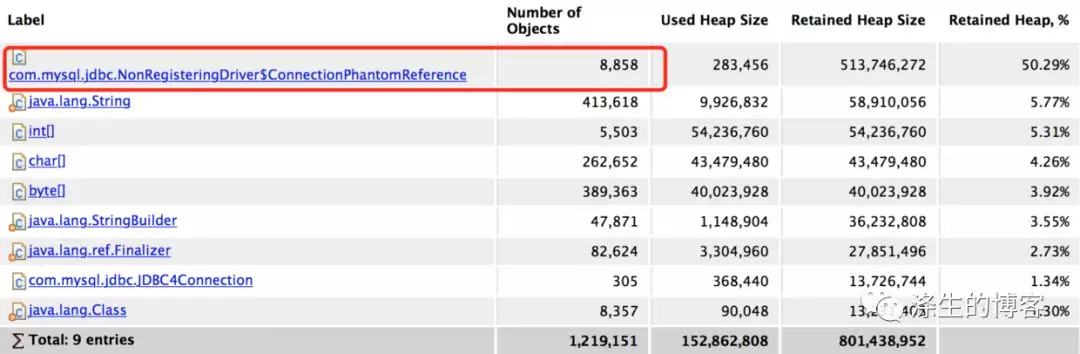
我们选择了第二种,用mat分析了下dump文件。从下图类的名字上也能很明显看出,就是ConnectionPhantomReference对象了。
根据包名com.mysql.jdbc,看来要想搞清楚问题的根源,还得撸下jdbc的源码了。
ConnectionPhantomReference产生的原因
一般PhantomReference是用来在GC时做相关的做资源回收工作,这里也不例外。
我们来看下ConnectionPhantomReference类,从构造方法上看,有两个参数:
一个是ConnnectionImpl,不用想也知道是与数据库之间的连接对象。
一个是ReferenceQueue。
另外还有一个cleanup方法,是用来回收connection相关资源。
ReferenceQueue是用来做什么的呢?要了解这个问题就需要了解下PhantomReference是如何回收资源的。
被PhantomReference引用的对象在被GC时,JVM会将PhantomReference对象扔到refqueue,由ReferenceHandler线程取出放入到ReferenceQueue中,放入ReferenceQueue中做什么,莫急,待我慢慢道来。
static class ConnectionPhantomReference extends PhantomReference<ConnectionImpl> {
private NetworkResources io;
ConnectionPhantomReference(ConnectionImpl connectionImpl, ReferenceQueue<ConnectionImpl> q) {
super(connectionImpl, q);
try {
this.io = connectionImpl.getIO().getNetworkResources();
} catch (SQLException e) {
// if we somehow got here and there's really no i/o, we deal with it later
}
}
void cleanup() {
if (this.io != null) {
try {
this.io.forceClose();
} finally {
this.io = null;
}
}
}
}
了解了上述PhantomReference原理后,再看看ConnectionPhantomReference什么时候生成的。看下面代码,很明显是在生成数据库连接对象connection时,将connection包装成ConnectionPhantomReference存入connectionPhantomRefs这个ConcurrentHashMap中。
protected static void trackConnection(Connection newConn) {
ConnectionPhantomReference phantomRef = new ConnectionPhantomReference((ConnectionImpl) newConn, refQueue);
connectionPhantomRefs.put(phantomRef, phantomRef);
}
protected static final ConcurrentHashMap<ConnectionPhantomReference, ConnectionPhantomReference> connectionPhantomRefs = new ConcurrentHashMap<ConnectionPhantomReference, ConnectionPhantomReference>();
protected static final ReferenceQueue<ConnectionImpl> refQueue = new ReferenceQueue<ConnectionImpl>();
上面的connectionPhantomRefs和refQueue是NonRegisteringDriver这个类的类成员。
那connection资源的回收是怎么完成的呢?
public class AbandonedConnectionCleanupThread extends Thread {
private static boolean running = true;
private static Thread threadRef = null;
public AbandonedConnectionCleanupThread() {
super("Abandoned connection cleanup thread");
}
@Override
public void run() {
threadRef = this;
while (running) {
try {
Reference<? extends ConnectionImpl> ref = NonRegisteringDriver.refQueue.remove(100);
if (ref != null) {
try {
((ConnectionPhantomReference) ref).cleanup();
} finally {
NonRegisteringDriver.connectionPhantomRefs.remove(ref);
}
}
} catch (Exception ex) {
// no where to really log this if we're static
}
}
}
public static void shutdown() throws InterruptedException {
running = false;
if (threadRef != null) {
threadRef.interrupt();
threadRef.join();
threadRef = null;
}
}
}
原来是有另外一个类AbandonedConnectionCleanupThread在偷偷干这个事,AbandonedConnectionCleanupThread这个线程就是从NonRegisteringDriver.refQueue中拿到ConnectionPhantomReference,然后执行cleanup方法,最后删除connectionPhantomRefs这个ConcurrentHashMap中的ConnectionPhantomReference对象,完成connection相关资源的回收。
这里NonRegisteringDriver.refQueue中的PhantomReference就是之前提到由ReferenceHandler线程放进去的ConnectionPhantomReference对象。
看到这里大家应该明白,感情是jdbc为每个connection都生成了一个ConnectionPhantomReference,目的是为了当connection对象回收时,顺便回收相关资源。这其实是一个保底操作,是怕connnection资源被上层的连接池或者使用者忘记close,从而导致资源泄漏。
但是为什么这么多PhantomReference,通过GC日志看约有8000多个,也就是有8000多个数据库连接资源,而且都在Old Gen?
都在Old区很好解释,因为连接资源一般存活时间比较久,经过多次Young GC都能存活到Old区。
8000多个连接这确实有点多,其实存活的没那么多,看了下这个应用使用的数据源比较多,有10多个,每个数据源一主两从,并且连接池的最大连接数是36,随着程序使用过程中的数据库连接资源的生成与回收,时间长了,连接确实会不少。另外这个应用Old GC的时间间隔比较长,很多废弃的连接都不会及时回收,都会存活很久。
说了这么多都是在解释为什么有这么多PhantomReference对象。
现在问题的源头也找到了,我们怎么从源头解决这个问题呢?
其实也很简单,首先PhantomReference的产生是jdbc的保底措施,其实这种保底措施也不见得需要,一般数据库连接都是有连接池控制,连接池自身是会确保连接资源的回收,所以这个保底措施是不是可以disable掉,看了下源码,没有disable的地方,那只能程序解决了,解决方式也很简单,删掉connectionPhantomRefs这个ConcurrentHashMap中的数据就好了,这就减少PhantomReference的数量。来降低weak refs processing的处理时间,怎么删就不用说了吧。
总结
GC优化的问题,其实思路都是差不多的,找到问题的原因,也就找到了优化的点,下手起来也就没那么困难了。目前为止,这个问题确实是解决了,但是对于JVM处理8000多个PhantomReference,为啥耗时就这么长,具体到底做了什么,本人一直还有疑问,后面还需继续细细考究。