
JVM菜鸟进阶高手之路二MAT工具相关知识解惑原创
关于MAT工具相关知识解惑
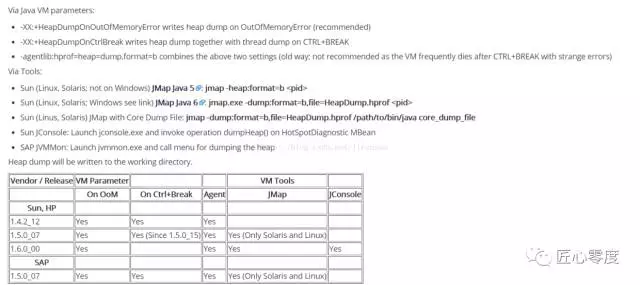
MAT 不是一个万能工具,它并不能处理所有类型的堆存储文件。但是比较主流的厂家和格式,例如 Sun, HP, SAP 所采用的 HPROF 二进制堆存储文件,以及 IBM 的 PHD 堆存储文件等都能被很好的解析,MAT下载地址,以及相关文档:http://www.eclipse.org/mat/downloads.php
获取堆信息:
我们使用如下命令获取:
jmap -dump:format=b,file=heap.bin pid
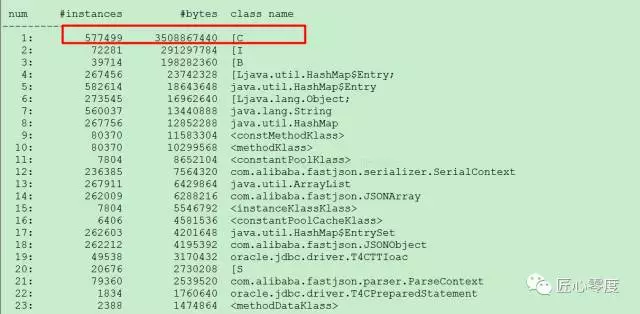
后面讲堆信息下载本地,通过MAT打开即可,第一个问题来了,我通过jmap相关命令得到的信息与MAT观察的信息不一致问题。如图所示:
而MAT里面显示如下:
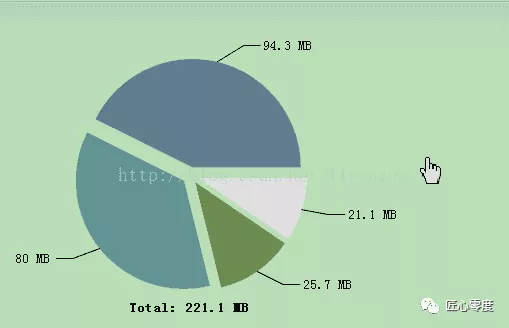
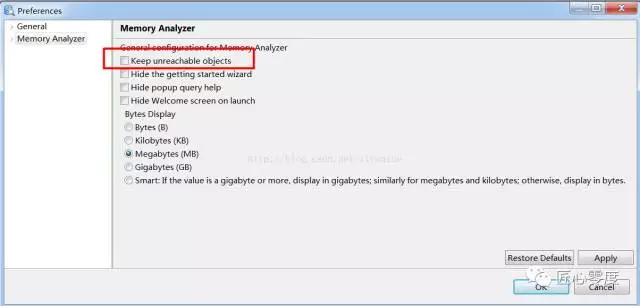
有没有觉得很奇怪,明明4G的堆,dump文件也是4G多,为什么用MAT打开就220M左右????? 奇怪吧,我也疑惑好久,因为因为MAT把不可达对象没加在里面,如果需要显示在MAT工具进行选择设置即可,如下:
第一个问题相对其他几个问题简单点。
关于第八篇Xmn问题
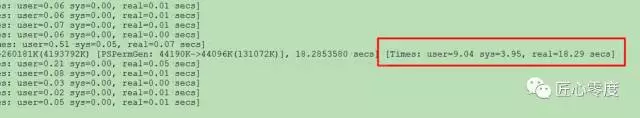
第八篇问题早上过来查看gc日志发现如图效果:
看到这个日志觉得非常奇怪 real为什么会这么大呢?先来看看关于 user、sys、real的意思吧。
我们先来看看linux下面的time相关命令,执行time ls

Real, User and Sys process time statistics One of these things is not like the other. Real refers to actual elapsed time; User and Sys refer to CPU time used only by the process. Real is wall clock time - time from start to finish of the call. This is all elapsed time including time slices used by other processes and time the process spends blocked (for example if it is waiting for I/O to complete).
User is the amount of CPU time spent in user-mode code (outside the kernel) within the process. This is only actual CPU time used in executing the process. Other processes and time the process spends blocked do not count towards this figure.
Sys is the amount of CPU time spent in the kernel within the process. This means executing CPU time spent in system calls within the kernel, as opposed to library code, which is still running in user-space. Like ‘user’, this is only CPU time used by the process. See below for a brief description of kernel mode (also known as ‘supervisor’ mode) and the system call mechanism.
User+Sys will tell you how much actual CPU time your process used. Note that this is across all CPUs, so if the process has multiple threads (and this process is running on a computer with more than one processor) it could potentially exceed the wall clock time reported by Real (which usually occurs). Note that in the output these figures include the User and Sys time of all child processes (and their descendants) as well when they could have been collected, e.g. by wait(2) or waitpid(2) , although the underlying system calls return the statistics for the process and its children separately. Origins of the statistics reported by time (1)
The statistics reported by time are gathered from various system calls. ‘User’ and ‘Sys’ come from wait (2) or times (2), depending on the particular system. ‘Real’ is calculated from a start and end time gathered from the gettimeofday (2) call. Depending on the version of the system, various other statistics such as the number of context switches may also be gathered by
其实如果这些看完就知道了,我当时没有看这块内容,问笨神了,不得不说笨神大大很牛逼啊,直接告诉我有可能那个时候因为swap导致gc慢了,最后经过一系列验证的确是swap问题,把这个关闭就没有这块的问题了。其实类似linux很重要,需要重点学习下。
其实IO也很重要,在后面的一个问题虽然不是IO问题,但是笨神提到了是否是IO问题,也是需要关注的一个点,sar(System Activity Reporter系统活动情况报告)是目前 Linux 上最为全面的系统性能分析工具之一,可以从多方面对系统的活动进行报告,包括:文件的读写情况、系统调用的使用情况、磁盘I/O、CPU效率、内存使用状况、进程活动及IPC有关的活动等。一句话sar非常牛逼。
敲入“sar”,如果提示没有进行安装:
yum install sysstat
安装成功后,sar有很多明白包括不限于, 查看CPU使用率、查看平均负荷、查看内存使用情况、查看页面交换发生状况、查看I/O和传送速率的统计信息等,重点看看IO这块:
-d option in the sar command is used to display the block device statistics report. Using option -p (pretty-print) along with -d make the dev column more readable, example is shown below :
sar -d -p 1
等相关命令。下面开始巨坑,该坑搞的我昨天晚上都没有修改好。

选择UseParallelOldGC垃圾回收器相关坑
问题由来,发现old涨的蛮快,觉得很奇怪,在思考为什么old涨的那么快呢?一般大概就几种情况:
-
新生代对象每经历依次minor gc,年龄会加一,当达到年龄阀值会直接进入老年代。阀值大小一般为15。
-
Survivor空间中年龄所有对象大小的总和大于survivor空间的一半,年龄大于或等于该年龄的对象就可以直接进入老年代,而无需等到年龄阀值。
-
大对象直接进入老年代。
-
新生代复制算法需要一个survivor区进行轮换备份,如果出现大量对象在minor gc后仍然存活的情况时,就需要老年代进行分配担保,让survivor无法容纳的对象直接进入老年代。
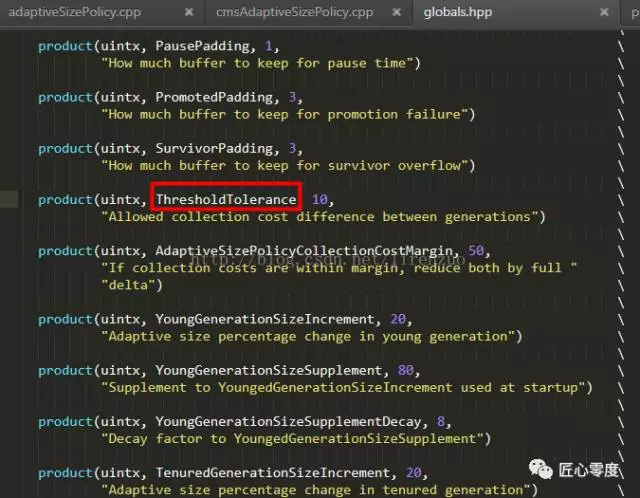
其实笨神分享过,这个参数主要作用是设置在YGC的时候,新生代的对象正常情况下最多经过多少次YGC的过程会晋升到老生代,注意是表示最多而不是一定,也就是说某个对象的age其实并不是一定要达到这个值才会晋升到Old的,当你设置这个值的时候,第一次会以它为准,后面的就不一定以它为准了,而是JVM会自动计算在0~15之间决定。如果配置了CMS GC,这个值默认是6,这个值最大你可以设置到15,因为jvm里就4个bit来存这个值,所以最大就是1111,即15。先通过命令:
jstat -gc pid 3s
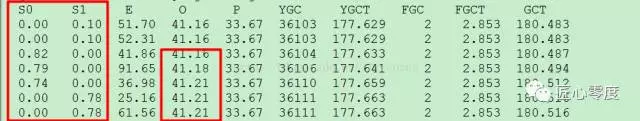
发现S0、S1才512k,很奇怪,以为是这块空间小了修改,-XX:SurvivorRatio=2,奇怪的问题发现啦,如图:
通过各种日志观察,见鬼啦,居然S0、S1大小在越来越小,对、你没有看错,PS下UseAdaptiveSizePolicy默认是打开的,对问题就是在这里,通过命令:
jinfo -flag UseAdaptiveSizePolicy pid
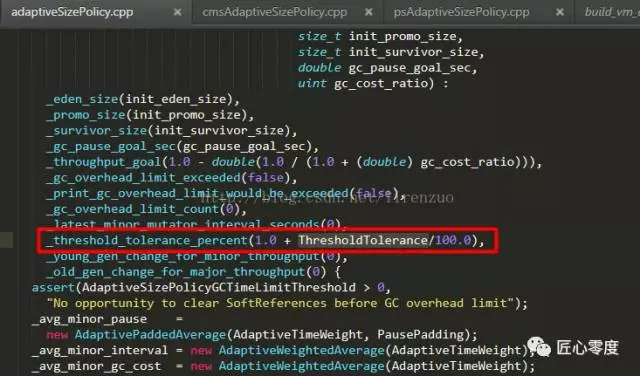
的确是打开的,而CMS默认是关闭的,所以有些同学可能也并没有注意到这块内容,该jvm实现代码在:https://github.com/dmlloyd/openjdk/blob/jdk9/jdk9/hotspot/src/share/vm/gc/parallel/psAdaptiveSizePolicy.cpp
感谢小峰提供并且读了源码。
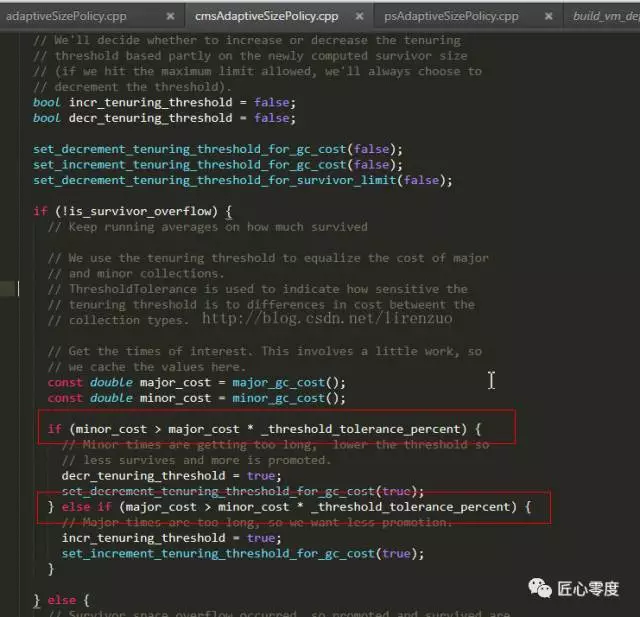
ps然后开启UseAdaptiveSizePolicy之后,晋升年龄阈值最后减到1了,是因为ps在开启这个之后,会判断young gc和full gc的上消耗的时间差。如果young gc>full gc1.1,threshold就会一直减少。反之,如果young1.1<full,threshold就会一直增加。 而我的应用确实young="" gc比较频繁,所以threshold一直减到了1,最小是1。<="" p="" style=“box-sizing: border-box;”>

通过 -XX:-UseAdaptiveSizePolicy 关闭,巨坑开始了就从这个参数开始。
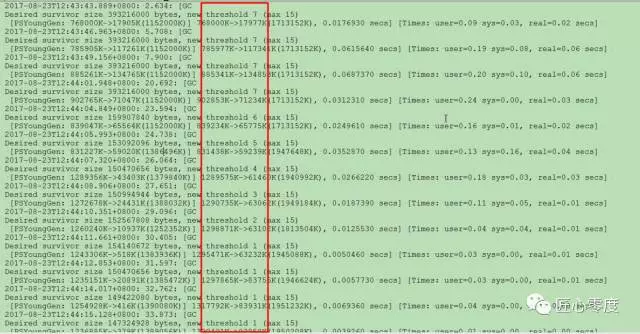
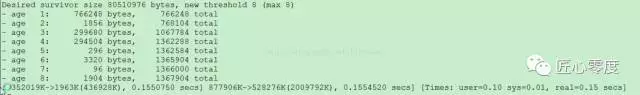
再此观察,old涨的还是涨,之前了解过这个参数,PrintTenuringDistribution,以前了解过,会有如下日志出现:
再此观察,日志里面一个类似age的都没有,以为不是对象年龄到了晋升到old的,怀疑是对象过大了,通过加 -XX:PretenureSizeThreshold=100m参数(这个参数其实只对串行回收器和ParNew有效,对ParallelGC无效), 再次观察,还是old很涨,如果巨坑来了,纠结一晚上。
这里的s0 s1空间很大啊 (看使用率很少) 为什么每次Old都会涨呢 并且没有发现gc日志有类似age的,大对象也设置啦,纠结啊,又是等笨神解答的,一直在纠结为什么old在涨呢,解释不通啦!ps下如果自适应策略关了也不会打印,把自适应策略关了,去掉那个UseAdaptiveSizePolicy参数就好了。
后续会结合jvm来判断蛛丝马迹来进行代码层面或者其他层面的优化,该类操作比较复杂也一直在摸索,希望一起进步。