
译 | Off-CPU Flame Graphs转载
On-CPU performance issues can solved using CPU Flame Graphs. That leaves off-CPU issues: the time spent by processes and threads when they are not running on-CPU. If this time is spent during an application request, synchronously, then it directly and proportionally affects performance.
CPU上的性能问题可以使用CPU火焰图解决。这就留下了off-CPU问题:进程和线程在非on-CPU上运行时所花费的时间。如果此时间是在应用程序请求期间同步花费的,那么它将直接且按比例地影响性能
I’ve previously documented the ****ysis of this off-CPU time as its own performance methodology: Off-CPU Analysis. On this page, I’ll explore this and related types of ****ysis using Flame Graphs.
我之前已经记录了这种off-CPU时间的分析,并将其作为自己的性能方法:off-CPU ****ysis。在本页中,我将使用Flame Graphs来探索这一点以及相关类型的分析。
Figure 1 illustrates off-CPU time, showing an application thread which blocks during a system call. This system call is called during an application request (eg, for file system reads). Around 60% of the application request time is blocked off-CPU during this system call – time that won’t be visible when only profiling on-CPU time.
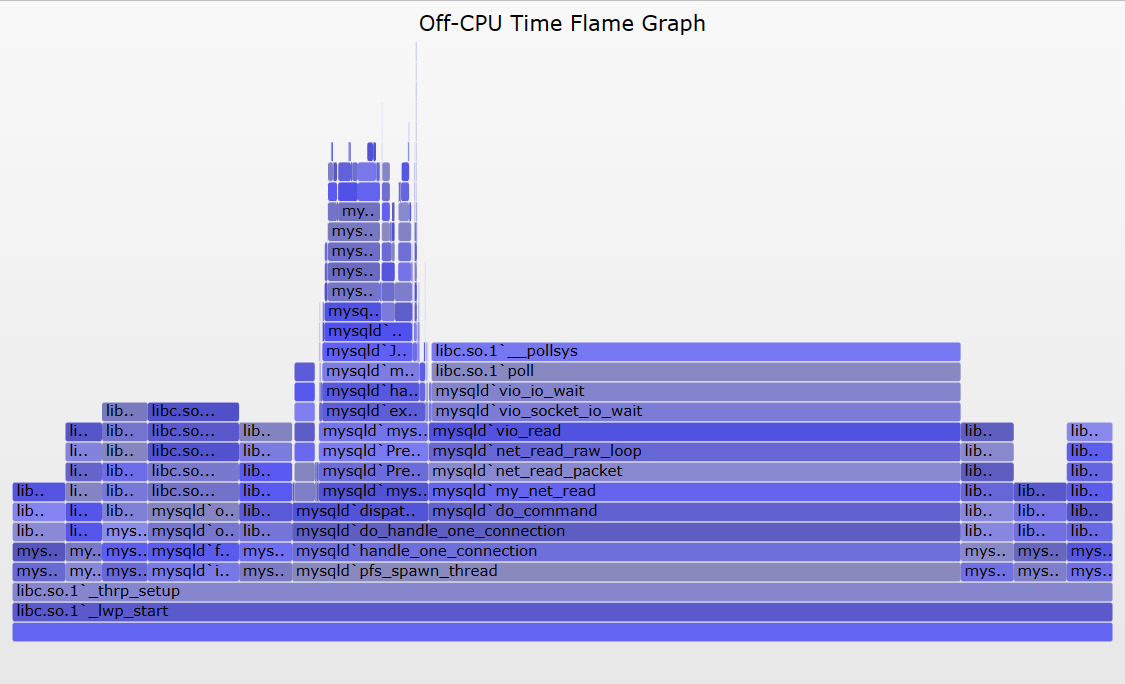
图1演示了off-CPU时间,显示了在系统调用期间阻塞的应用程序线程。此系统调用在应用程序请求期间被调用(例如,用于文件系统读取)。在这个系统调用期间,大约60%的应用程序请求时间在off-CPU被阻塞——当只分析on-CPU的时间时,这些时间是不可见的。
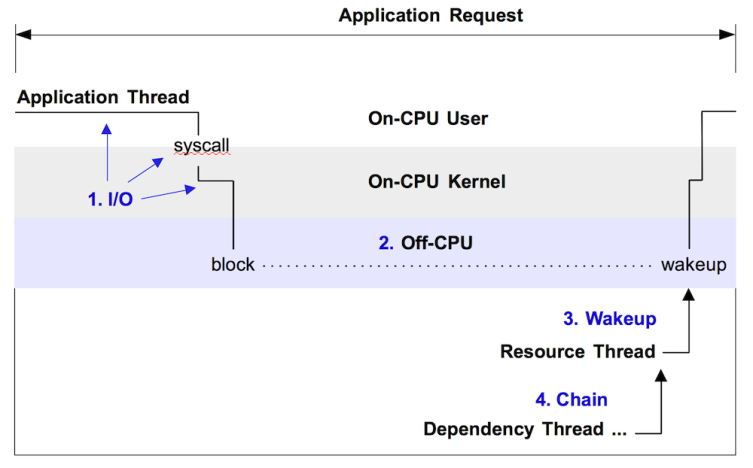
注意,这只显示了一种形式的off-CPU时间。由于不由自主的上下文切换(分时)、内存映射的磁盘I/O和调度器延迟,应用程序也可能在off-CPU花费时间。这些可能不涉及系统调用。我在USENIX LISA 2013全体会议的后面部分和最近的USENIX ATC 2017演讲中首先总结了off-CPU时间火焰图,从50:16开始(youtube,幻灯片)。
There are at least four approaches for ****yzing off-CPU time with flame graphs, enumerated in figure 1 and explained in following sections. These should be read in-order, as each section provides background for the next.
至少有四种方法可以用火焰图分析off-CPU时间,如图1所示,并在接下来的章节中进行解释。这些内容应该按顺序阅读,因为每一部分都为下一部分提供了背景。
Prerequisites(先决条件)
All of the following approaches require stack traces to be available to tracers, which you may need to fix first. Many applications are compiled with the -fomit-frame-pointer gcc option, breaking frame pointer-based stack walking. VM runtimes like Java compile methods on the fly, and tracers may not find their symbol information without additional help, causing the stack trace to be hexadecimal only. There are other gotchas as well. See my previous write ups on fixing Stack Traces and JIT Symbols for perf.
以下所有方法都要求堆栈跟踪对跟踪程序可用,您可能需要首先解决这个问题。许多应用程序都使用-fomit-frame-pointer gcc选项进行编译,从而中断了基于帧指针的堆栈遍历。VM运行时(如Java)会动态编译方法,如果没有额外的帮助,跟踪程序可能无法找到它们的符号信息,导致堆栈跟踪只能是十六进制的。还有其他陷阱。请参阅我以前关于修复堆栈跟踪和JIT符号的文章。
Overhead(开销)
WARNING: These tracing approaches trace I/O events or scheduler events, which can be very frequent – millions of events per second – and although tracers may only add a tiny amount of overhead to each event, due to the event rate that overhead can add up and become significant. Pay attention to overhead and the rate of the event you are tracing. I discussed this in more detail here: Off-CPU Analysis Overhead.
警告:这些跟踪方法跟踪I/O事件或调度器事件,这些事件可能非常频繁——每秒数百万个事件——尽管跟踪程序可能只会给每个事件增加少量的开销,但由于事件速率的增加,开销可能会变得很大。注意开销和您正在跟踪的事件的速率。我在这里更详细地讨论了这一点:off-CPU分析开销。
Linux: perf, eBPF
The following are generic approaches. I’ll use Linux as the target example, then summarize other OSes.
以下是通用方法。我将以Linux为目标示例,然后总结其他操作系统。
There are many tracers available on Linux for off-CPU ****ysis. I’ll mostly use bcc/eBPF here, and some perf, both of which are standard Linux tracers. These are part of the Linux kernel source. perf works on older Linux systems, whereas eBPF requires at least Linux 4.8 for doing stack traces. eBPF can more easily do in-kernel summaries, making it more efficient and lowering overhead, which is important here.
Linux上有许多用于off-CPU分析的跟踪程序。这里我主要使用bcc/eBPF和一些perf,它们都是标准的Linux跟踪程序。这些都是Linux内核源代码的一部分。perf可以在旧的Linux系统上工作,而eBPF至少需要Linux 4.8才能进行堆栈跟踪。eBPF可以更容易地进行内核内摘要,使其更高效并降低开销,这在这里很重要。
1. I/O
Kernels usually provide facilities for tracing I/O types, such as disk I/O or I/O related system calls. Since I/O is mostly off-CPU time, tracing I/O is a form of off-CPU ****ysis. Although some I/O may not leave the CPU at all, for example, file system cache hits. To generate a flame graph, the tracing facility needs to capture the I/O time and the stack trace or code-path that led to the I/O. For stack traces, we can use eBPF or perf.
内核通常提供跟踪I/O类型的工具,例如磁盘I/O或与I/O相关的系统调用。由于I/O大部分时间都是off-CPU时间,因此跟踪I/O是一种off-CPU分析。尽管有些I/O可能根本不会离开CPU,例如,文件系统缓存命中。为了生成火焰图,跟踪工具需要捕获导致I/O的I/O时间和堆栈跟踪或代码路径。对于堆栈跟踪,我们可以使用eBPF或perf。
Pay attention to the I/O context, whether it is synchronous to the application request or not. If it is synchronous, then I/O latency causes direct application latency, and the resulting flame graph is a direct measure of performance. An example of this is where an application performs (blocking) file system reads, which block on disk I/O. Asynchronous I/O may or may not affect the application, or may but in an indirect way. An example of this is a file system which buffers writes and flushes them to disk later. The eventual I/O and their latency may be high, but not endured directly by the application. They may be endured indirectly, as contention with later synchronous reads.
注意I/O上下文,它是否与应用程序请求同步。如果它是同步的,那么I/O延迟会导致直接的应用程序延迟,由此产生的火焰图是性能的直接度量。这方面的一个例子是应用程序执行(阻塞)文件系统读取,这阻塞在磁盘I/O上。异步I/O可能会影响应用程序,也可能不会,也可能会间接影响应用程序。这方面的一个例子是一个文件系统,它缓冲写入并稍后将它们刷新到磁盘。最终的I/O及其延迟可能很高,但应用程序不会直接承受。它们可以间接地忍受,如与后面的同步读取的争用。
1.1. File I/O
As an example of I/O tracing, here is my fileslower tool from bcc, which traces reads and writes from the VFS interface:
作为I/O跟踪的一个例子,下面是我来自bcc的fileslower工具,它从VFS接口跟踪读写:
# fileslower 1
Tracing sync read/writes slower than 1 ms
TIME(s) COMM PID D BYTES LAT(ms) FILENAME
0.000 bash 9647 R 128 5.83 man
0.050 man 9647 R 832 19.52 libmandb-2.6.7.1.so
0.066 man 9647 R 832 15.79 libman-2.6.7.1.so
0.123 man 9647 R 832 56.36 libpipeline.so.1.3.0
0.135 man 9647 R 832 9.79 libgdbm.so.3.0.0
0.323 man 9647 R 4096 59.52 locale.alias
0.540 man 9648 R 8192 11.11 ls.1.gz
0.558 man 9647 R 72 6.97 index.db
[...]
The argument to that tool is the duration threshold for printing events. I would expect that by setting it to 1 millisecond, it would mostly show I/O that blocked on the storage devices, since I/O that was served from cache would be CPU only and return quicker than one millisecond (usually).
该工具的参数是打印事件的持续时间阈值。我希望通过将其设置为1毫秒,它将主要显示在存储设备上阻塞的I/O,因为从缓存提供的I/O将仅用于CPU,并且返回速度比1毫秒快(通常)。
For flame graphs, we need stack traces. I created a new bcc/eBPF tool to do this, fileiostacks, based on the following tracing pseudocode:
对于火焰图,我们需要堆栈痕迹。我创建了一个新的bcc/eBPF工具来做到这一点,文件堆栈,基于以下跟踪伪代码:
on file read/write function entry:
start[thread_id] = timestamp
on file read/write function return:
if !start[thread_id]
return
delta = timestamp - start[thread_id]
totaltime[PID, execname, user stack] += delta
start[thread_id] = 0
on tracer exit:
for each key in totaltime:
print key
print totaltime[key]
As an implementation detail, the bcc/eBPF program currently saves user stacks as raw addresses, and does symbol translation when printing.
作为实现细节,bcc/eBPF程序目前将用户堆栈保存为原始地址,并在打印时进行符号转换。
Here is some sample output:
以下是一些输出示例:
# ./fileiostacks.py
Tracing VFS read/write time (us) of all threads by user stack... Hit Ctrl-C to end.
^C
[...]
__GI___libc_pread
Query_cache::store_query(THD*, TABLE_LIST*)
handle_query(THD*, LEX*, Query_result*, unsigned long long, unsigned long long)
[unknown]
mysql_execute_command(THD*, bool)
Prepared_statement::execute(String*, bool)
Prepared_statement::execute_loop(String*, bool, unsigned char*, unsigned char*)
mysqld_stmt_execute(THD*, unsigned long, unsigned long, unsigned char*, unsigned long)
dispatch_command(THD*, COM_DATA const*, enum_server_command)
do_command(THD*)
handle_connection
pfs_spawn_thread
start_thread
- mysqld (1744)
13124
__GI___libc_pread
[unknown]
os_file_read_func(IORequest&, int, void*, unsigned long, unsigned long)
fil_io(IORequest const&, bool, page_id_t const&, page_size_t const&, unsigned long, unsigned long, void*, void*)
buf_read_page(page_id_t const&, page_size_t const&)
buf_page_get_gen(page_id_t const&, page_size_t const&, unsigned long, buf_block_t*, unsigned long, char const*, unsigned long, mtr_t*, bool)
btr_cur_search_to_nth_level(dict_index_t*, unsigned long, dtuple_t const*, page_cur_mode_t, unsigned long, btr_cur_t*, unsigned long, char const*, unsigned long, mtr_t*)
[unknown]
ha_innobase::records_in_range(unsigned int, st_key_range*, st_key_range*)
handler::multi_range_read_info_const(unsigned int, st_range_seq_if*, void*, unsigned int, unsigned int*, unsigned int*, Cost_estimate*)
DsMrr_impl::d**rr_info_const(unsigned int, st_range_seq_if*, void*, unsigned int, unsigned int*, unsigned int*, Cost_estimate*)
[unknown]
test_quick_select(THD*, Bitmap<64u>, unsigned long long, unsigned long long, bool, st_order::enum_order, QEP_shared_owner const*, Item*, Bitmap<64u>*, QUICK_SELECT_I**)
JOIN::estimate_rowcount()
JOIN::make_join_plan()
JOIN::optimize()
st_select_lex::optimize(THD*)
handle_query(THD*, LEX*, Query_result*, unsigned long long, unsigned long long)
[unknown]
mysql_execute_command(THD*, bool)
Prepared_statement::execute(String*, bool)
Prepared_statement::execute_loop(String*, bool, unsigned char*, unsigned char*)
mysqld_stmt_execute(THD*, unsigned long, unsigned long, unsigned char*, unsigned long)
dispatch_command(THD*, COM_DATA const*, enum_server_command)
do_command(THD*)
handle_connection
pfs_spawn_thread
start_thread
- mysqld (3652)
27596
The output was many pages long. I’ve just included two sample stack traces, which show 13 and 27 milliseconds of time total in those code paths from mysqld (a MySQL database server).
结果有好几页。我刚刚包含了两个示例堆栈跟踪,它们显示了来自mysqld (MySQL数据库服务器)的代码路径中总共13毫秒和27毫秒的时间。
fileiostacks has a -f option for emitting stack traces in “folded format”: semi-colon delimited on one line, followed by the total time blocked. This is the format that my FlameGraph software takes as input.
Fileiostacks有一个-f选项,用于以“折叠格式”发出堆栈跟踪:在一行上分隔分号,后面跟着阻塞的总时间。这是我的flamamegraph软件作为输入的格式。
Here are the steps for generating a file I/O time flame graph, for 30 seconds:
以下是生成文件I/O时间火焰图的步骤,持续30秒:
# ./fileiostacks.py -f 30 > out.stacks
[...copy out.stacks to your local system if desired...]
# git clone https://github.com/brendangregg/FlameGraph
# cd FlameGraph
# ./flamegraph.pl --color=io --title="File I/O Time Flame Graph" --countname=us < out.stacks > out.svg
Then open out.svg in a web browser. Here is an example (SVG, PNG):
然后在web浏览器中打开out.svg。下面是一个例子(SVG, PNG):
Great. The width is proportional to the total time in the code paths, so look for the widest towers first to understand the biggest sources of latency. The left-to-right ordering has no meaning, and the y-axis is the stack depth.
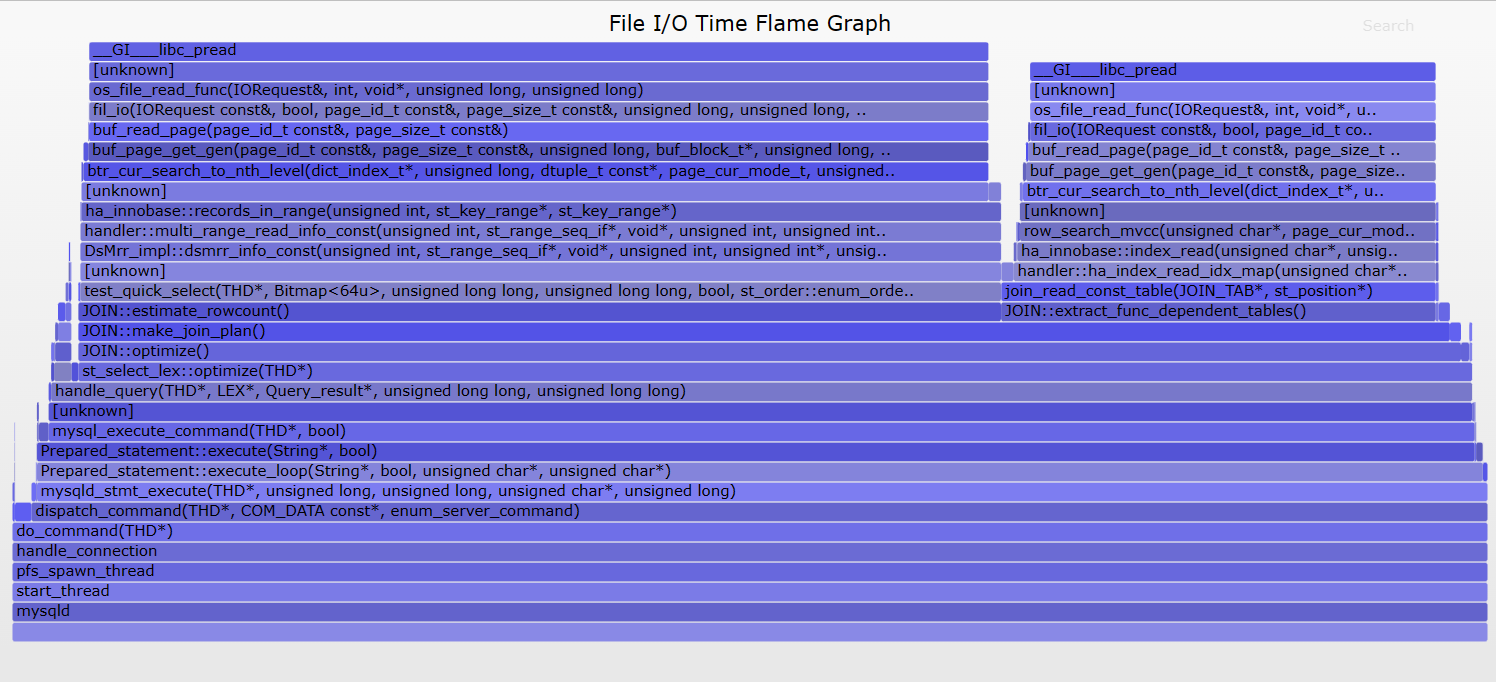
太好了。宽度与代码路径中的总时间成比例,因此首先寻找最宽的塔,以了解最大的延迟来源。从左到右的顺序没有任何意义,y轴是堆栈深度。
I actually generated that flame graph with a filter on the do_command() MySQL function, so that it only showed latencies during an database client request. Since the folded format is single-line entries, it’s easy to filter for things using grep:
实际上,我在do_command() MySQL函数上使用过滤器生成了火焰图,这样它只显示数据库客户端请求期间的延迟。由于折叠格式是单行条目,使用grep可以很容易地过滤内容:
# grep do_command out.stacks | ./flamegraph.pl --color=io --title="File I/O Time Flame Graph" --countname=us > out.svg
You can adjust the grep pattern to match what you are looking for.
您可以调整grep模式以匹配您正在寻找的内容。
1.2. Block Device I/O
The previous example traced reads and writes from the VFS interface, which is close to the application’s request. I/O can also traced from other points in the kernel stack, such as block device I/O, storage driver I/O, different layers in the TCP/IP stack, etc. As an example here, I’ll move down to block device I/O.
前面的示例跟踪VFS接口的读写,该接口接近应用程序的请求。I/O还可以从内核堆栈中的其他点跟踪,例如块设备I/O、存储驱动程序I/O、TCP/IP堆栈中的不同层等。作为一个例子,我将向下移动到块设备I/O。
Since block device I/O (disk I/O) is usually relatively infrequent when compared to scheduler events, I haven’t always needed eBPF’s efficient in-kernel summaries for tracing it. A very simple way to ****yze disk I/O with flame graphs is to use perf to simple trace their rate, then render that as a flame graph. Eg:
由于与调度器事件相比,块设备I/O(磁盘I/O)通常相对较少,因此我并不总是需要eBPF高效的内核内摘要来跟踪它。使用火焰图分析磁盘I/O的一种非常简单的方法是使用perf简单地跟踪它们的速率,然后将其渲染为火焰图。例如:
# perf record -e block:block_rq_insert -a -g -- sleep 30
# perf script --header > out.stacks
[...copy out.stacks to your local system if desired...]
# git clone https://github.com/brendangregg/FlameGraph
# cd FlameGraph
# ./stackcollapse-perf.html < out.stacks | ./flamegraph.pl --color=io \
--title="Block I/O Flame Graph" --countname="I/O" > out.svg
Then open out.svg in a web browser. Here is an example (SVG, PNG):
然后在web浏览器中打开out.svg。下面是一个例子(SVG, PNG):
Not bad. The widths are relative to I/O counts, not time, but it’s still useful as a rough look at who is causing disk I/O. I actually filtered on the mysqld do_command function like last time, and also demangled the C++ symbols (since perf didn’t automatically), so my actual command for generating this was:
不坏。宽度与I/O计数有关,而不是时间,但它仍然可以粗略地查看是谁导致了磁盘I/O。我实际上过滤了mysqld do_command函数,就像上次一样,也要求c++符号(因为perf不会自动),所以我生成这个的实际命令是:
# ./stackcollapse-perf.html < out.stacks | grep do_command | c++filt | \
./flamegraph.pl --color=io --title="Block I/O Flame Graph" --countname="I/O" > out.svg
It would be better to measure block I/O with stacks and the time of the I/O, so I created a new bcc/eBPF tool to do this, biostacks, based on the following tracing pseudocode:
用堆栈和I/O的时间来测量块I/O会更好,所以我创建了一个新的bcc/eBPF工具来做到这一点,biostacks,基于以下跟踪伪代码:
on block I/O queue insertion:
start[request_id] = timestamp
info[request_id] = [PID, execname, user stack, kernel stack]
on block I/O completion:
if !start[request_id] or !info[request_id]
return
delta = timestamp - start[request_id]
totaltime[info[request_id]] += delta
start[request_id] = 0
info[request_id] = 0
on tracer exit:
for each key in totaltime:
print key
print totaltime[key]
Some notes on this: process and stack context is measured at the start, when the block I/O is first created and inserted onto a queue. This is because the block I/O completion is asynchronous, and measuring the context on completion would not identify who caused the I/O. Another detail is that the information is keyed in a request_id, rather than a thread_id.
这里需要注意:进程和堆栈上下文是在开始时测量的,即块I/O第一次创建并插入到队列中时。这是因为块I/O完成是异步的,测量完成时的上下文并不能确定是谁引起了I/O。另一个细节是,信息输入的是request_id,而不是thread_id。
Here are the steps for generating a block I/O time flame graph, for 30 seconds:
以下是生成块I/O时间火焰图的步骤,持续30秒:
# ./biostacks.py -f 30 > out.stacks
[...copy out.stacks to your local system if desired...]
# git clone https://github.com/brendangregg/FlameGraph
# cd FlameGraph
# ./flamegraph.pl --color=io --title="Block I/O Time Flame Graph" --countname=us < out.stacks > out.svg
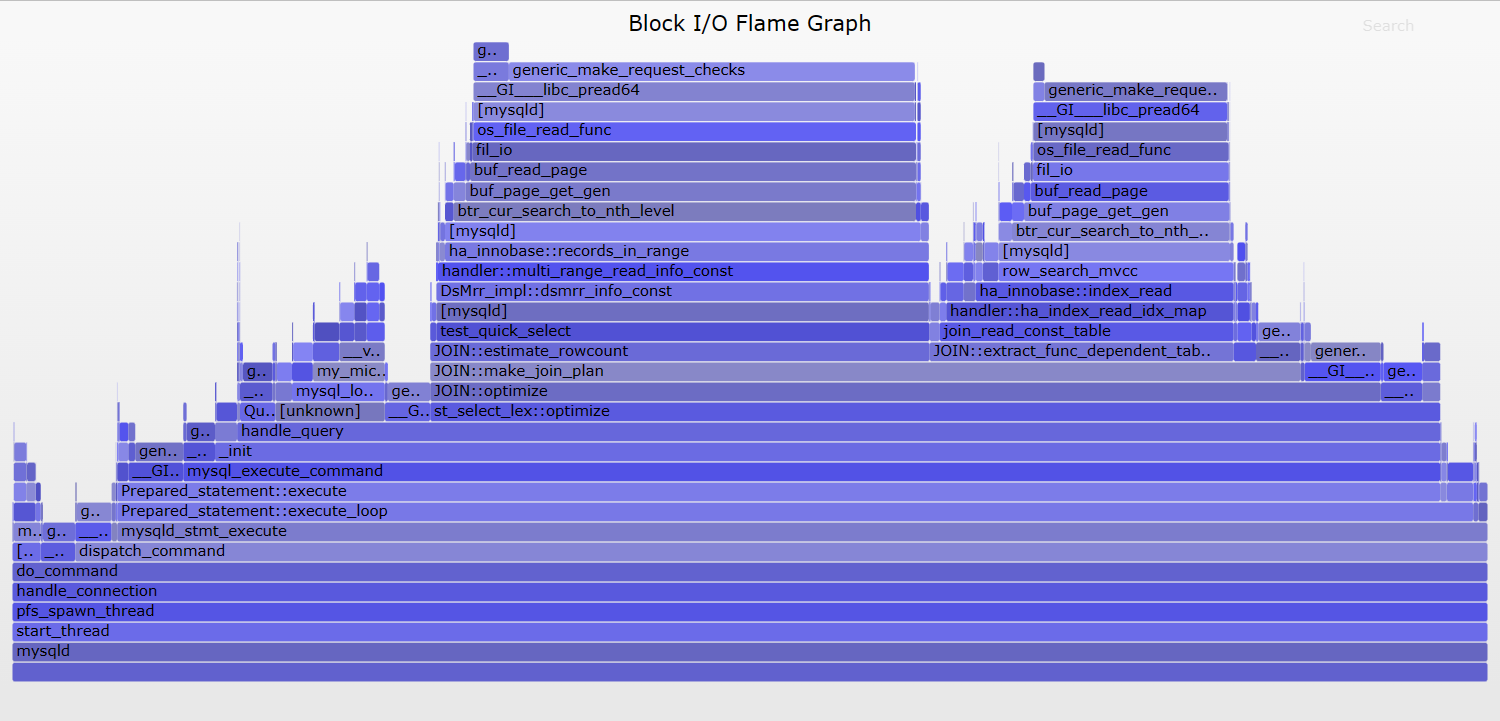
Here is an example (SVG, PNG):
下面是一个例子(SVG, PNG):
Great. This is now showing MySQL code paths causing storage device (disk) I/O, and the total durtion of that disk I/O. Most of the I/O is from JOIN::optimize(), shown as the tower in the middle.
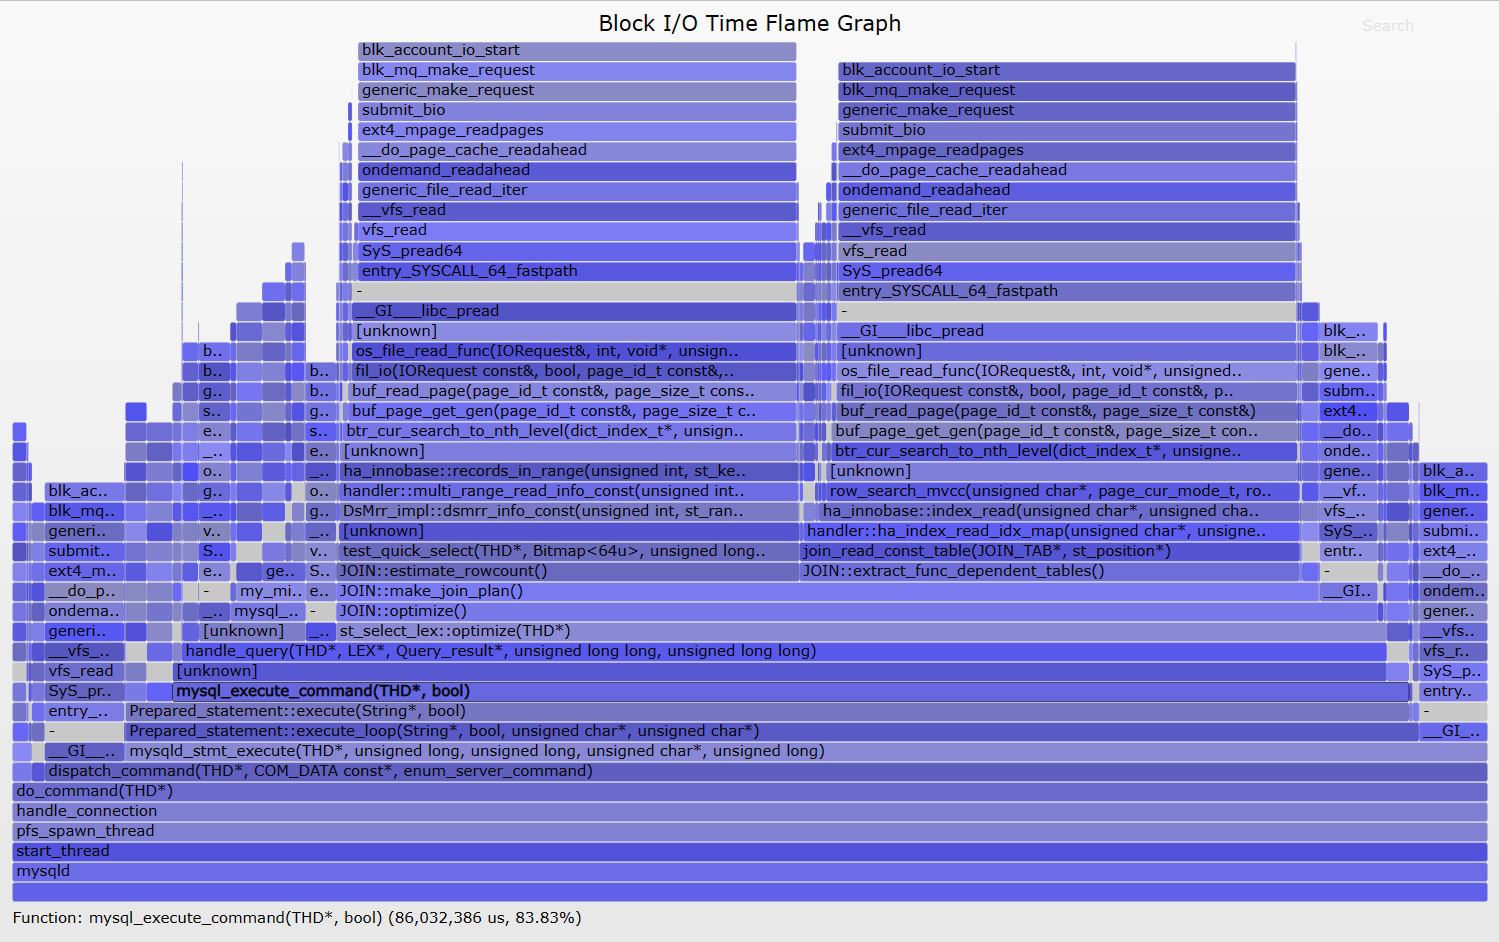
太好了。现在显示MySQL代码路径导致存储设备(磁盘)I/O,以及该磁盘I/O的总持续时间。大部分I/O来自JOIN::optimize(),如中间的塔所示。
I actually filtered the flame graph to only show paths in do_command(), like so:
我实际上过滤了火焰图,只显示do_command()中的路径,如下所示:
# grep do_command out.stacks | ./flamegraph.pl --color=io --title="File I/O Time Flame Graph" --countname=us > out.svg
An unfiltered flame graph is here.
这里有一张未经过滤的火焰图。
These block I/O time flame graphs show who is causing the I/O and their duration, but not necessarily their effect on application latency. If the I/O was synchronous, it will have also caused latency in mysqld, but that may not be the case – it may be asynchronous I/O that didn’t block mysqld. To focus on blocking events, we can make an off-CPU flame graph instead.
这些块I/O时间火焰图显示了谁引起了I/O及其持续时间,但不一定是它们对应用程序延迟的影响。如果I/O是同步的,它也会在mysqld中引起延迟,但情况可能并非如此——可能是异步I/O没有阻塞mysqld。为了专注于阻塞事件,我们可以制作一个off-CPU火焰图。
2. Off-CPU
This is a generic approach for ****yzing all off-CPU events, including I/O. I’ve documented it separately as a methodology: Off-CPU Analysis. It is also the counterpart to on-CPU ****ysis, as can be performed by using CPU Flame Graphs. Off-CPU time flame graphs show the time threads spend off-CPU, with their stack traces. Yichun Zhang (agentzh) first created these using SystemTap, and gave a great presentation (PDF) about them with examples of their use on Nginx. I’ve also previously posted how to create these using perf, Linux perf off-CPU flame graph, but that was a higher-overhead workaround until eBPF was available to do this.
这是分析所有脱离cpu事件(包括I/O)的通用方法。我将其单独记录为一种方法:Off-CPU Analysis。它也是on-CPU的分析,可以通过使用CPU火焰图来执行。off-CPU时间火焰图显示线程花费在离开cpu上的时间,以及它们的堆栈跟踪。Yichun Zhang (agentzh)首先使用SystemTap创建了这些,并给出了一个关于它们在Nginx上使用的示例的很棒的演示(PDF)。我之前也发布过如何使用perf, Linux perf off-CPU火焰图来创建这些,但在eBPF可用之前,这是一种更高开销的解决方法。
I’ve written about eBPF off-CPU flame graphs before, however at that time eBPF didn’t support stack traces, so I had to hack in my own BPF stack walker. Since 4.8, eBPF has stack trace support, now used by my eBPF tool offcputime for measuring measure off-CPU duration with stack traces, for use with flame graphs.
我以前写过关于eBPF的off-CPU火焰图,但是当时eBPF不支持堆栈跟踪,所以我不得不黑进我自己的BPF堆栈行走器。从4.8开始,eBPF有堆栈跟踪支持,现在我的eBPF工具offcputime使用堆栈跟踪来测量度量off-CPU的持续时间,用于火焰图。
Here is the tracing pseudocode for tracing off-CPU stacks with times:
下面是跟踪非cpu堆栈的伪代码:
on context switch finish:
sleeptime[prev_thread_id] = timestamp
if !sleeptime[thread_id]
return
delta = timestamp - sleeptime[thread_id]
totaltime[pid, execname, user stack, kernel stack] += delta
sleeptime[thread_id] = 0
on tracer exit:
for each key in totaltime:
print key
print totaltime[key]
Some notes on this: all measurements happen from one instrumentation point, the end of the context switch routine, which is in the context of the next thread (eg, the Linux finish_task_switch() function). That way, we can calculate the off-CPU duration at the same time as retrieving the context for that duration by simply fetching the current context (pid, execname, user stack, kernel stack), which tracers make easy. If this were to instrument the beginning of the context switch, in the context of the thread that’s beginning to go to sleep, then this would become more complex and require saving and retrieving that context. Also note that we can fetch the stack traces at the end of the off-CPU duration and they’ll be the same as at the start: the thread hasn’t been running, so the stack hasn’t changed.
这里需要注意的是:所有测量都发生在一个检测点,即上下文切换例程的结束,该例程位于下一个线程的上下文中(例如,Linux finish_task_switch()函数)。这样,我们可以通过获取当前上下文(pid、execname、用户堆栈、内核堆栈),在检索该时间的上下文的同时计算出离开cpu的持续时间,跟踪程序使这变得很容易。如果这是在开始进入睡眠状态的线程上下文中检测上下文切换的开始,那么这将变得更加复杂,需要保存和检索该上下文。还要注意,我们可以在off-CPU持续时间结束时获取堆栈跟踪,它们将与开始时相同:线程还没有运行,因此堆栈没有改变。
For example output of offcputime, see Off-CPU Analysis. WARNING: offcputime traces scheduler events, which may be frequent, and so the overhead can add up to become noticable. See my discussion in Off-CPU Analysis Overhead.
例如offcputime的输出,请参见Off-CPU Analysis。警告:offcputime跟踪调度器事件,这些事件可能很频繁,因此开销会增加到很明显。请参阅我在Off-CPU分析开销中的讨论。
Here are the steps for creating an off-CPU time flame graph with offcputime, tracing 30 seconds for the PID of a MySQL server:
下面是使用offcputime创建一个off-CPU时间火焰图的步骤,为MySQL服务器的PID跟踪30秒:
# /usr/share/bcc/tools/offcputime -df -p `pgrep -nx mysqld` 30 > out.stacks
[...copy out.stacks to your local system if desired...]
# git clone https://github.com/brendangregg/FlameGraph
# cd FlameGraph
# ./flamegraph.pl --color=io --title="Off-CPU Time Flame Graph" --countname=us < out.stacks > out.svg
Then open out.svg in a web browser. It looks like this (SVG, PNG):
然后在web浏览器中打开out.svg。它看起来像这样(SVG, PNG):
The blocking file I/O is shown as the taller towers on the right, now showing what truly blocked mysqld. This time there also are delimiter frames “-” between the kernel and user stacks, which were inserted by offcputime’s -d option.
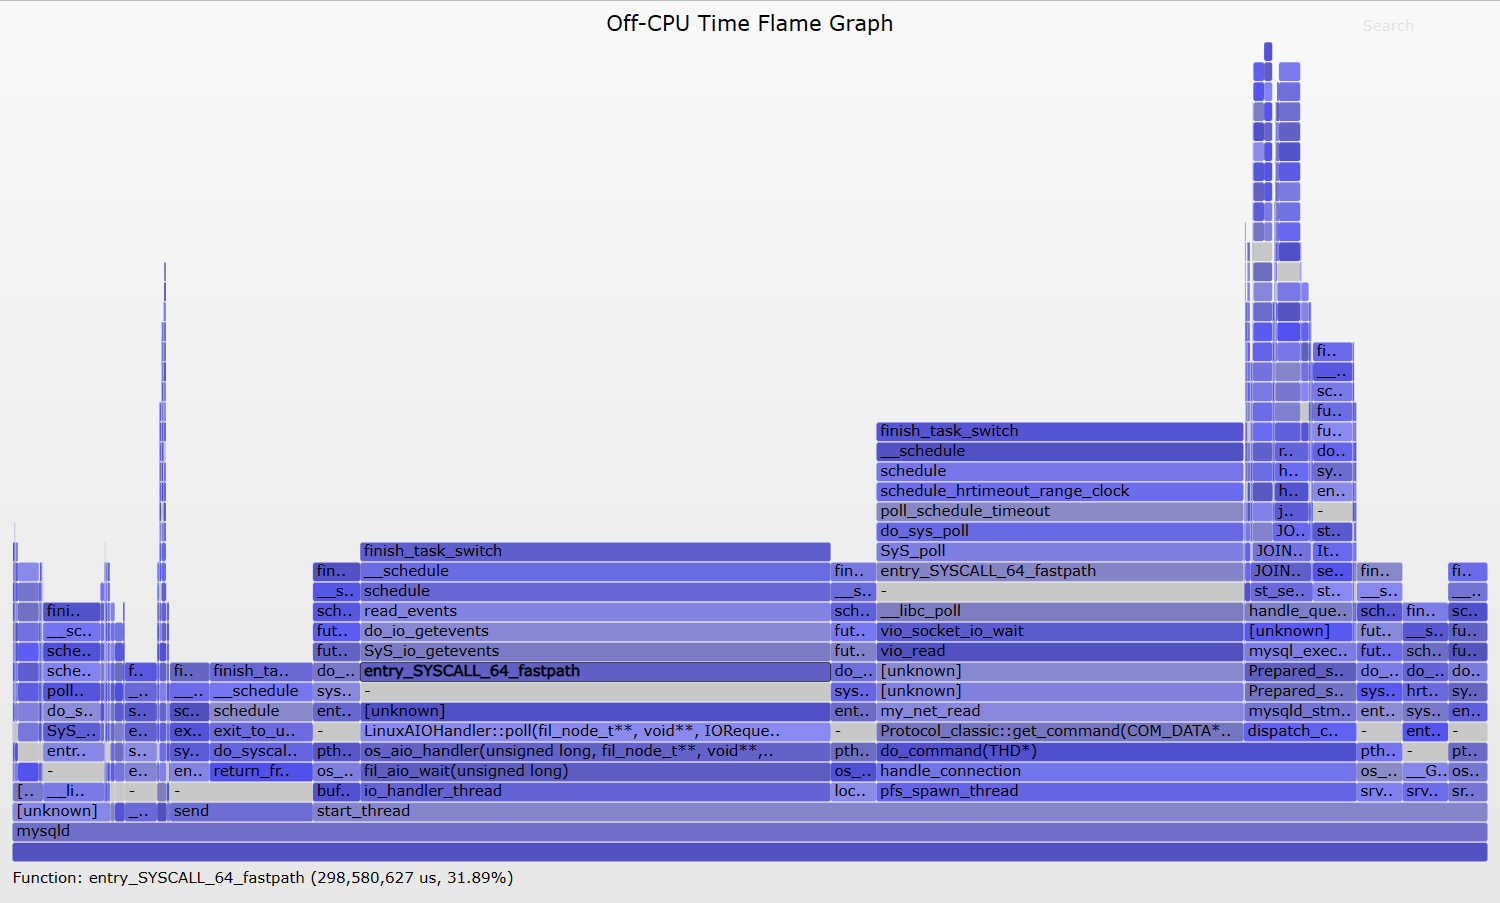
阻塞文件I/O显示为右边的高塔,现在显示了真正阻塞mysqld的内容。这一次,内核和用户堆栈之间还有分隔帧“-”,它们是由offcputime的-d选项插入的。
Now a problem with this type of ****ysis is evident: this flame graph shows considerable off-CPU time other than the disk I/O, but that time is largely for threads that are sleeping waiting for work. This is fascinating for a number of reasons:
现在,这种类型的分析有一个明显的问题:这个火焰图显示了除磁盘I/O之外的相当多的离开cpu时间,但是这些时间主要用于正在等待工作的线程。这很吸引人,原因如下:
- This has revealed various code-paths that MySQL uses for housekeeping or waiting for work. There are a number of columns that represent a single thread, and if you mouse-over the 4th row from the bottom, the function name describes the thread’s task. Eg, io_handler_thread, lock_wait_timeout_thread, pfs_spawn_thread, srv_error_monitor_thread, etc. This reveals details about mysqld’s higher level architecture.
这揭示了MySQL用于管理或等待工作的各种代码路径。有许多列表示单个线程,如果将鼠标移到从底部开始的第4行上,则函数名描述了线程的任务。例如,io_handler_thread, ,lock_wait_timeout_thread, ,pfs_spawn_thread, ,srv_error_monitor_thread, etc. This reveals details about mysqld’s higher level architecture. 等。这揭示了mysqld的高级架构的细节。
- Some of these columns are between 25 and 30 seconds wide. These are likely to represent single threads. One shows 30 seconds, some 29 seconds, and one is 25 seconds. I would guess that these are for threads which wake up every 1 or 5, with the final wakeup either caught or not by the 30 second tracing window.
有些列的宽度在25到30秒之间。它们可能表示单个线程。一个显示30秒,一个显示29秒,一个显示25秒。我猜这些是针对每1或5次唤醒一次的线程,最终的唤醒被30秒跟踪窗口捕获或不捕获。
- Some columns are more than 30 seconds wide, such as io_handler_thread and pfs_spawn_thread. These are likely to represent a pool of threads that are executing the same code, and their total wait time sums to be higher than the elapsed tracing time.
有些列的宽度超过30秒,例如io_handler_thread and 而且pfs_spawn_thread. 它们很可能表示执行相同代码的线程池,并且它们的总等待时间总和要高于经过的跟踪时间。
There are a few challenges with this type of ****ysis. Having multiple threads on one flame graph can be more confusing than it was for CPU flame graphs, since off-CPU time usually overlaps, and a pool of idle threads can dominate – as we saw here. We can either zoom to the more interesting towers, or use some command line filtering to automate that (grep do_command …).
这种类型的分析存在一些挑战。在一个火焰图上有多个线程比CPU火焰图更令人困惑,因为离开CPU的时间通常重叠,空闲线程池可能占主导地位——正如我们在这里看到的。我们可以放大到更有趣的塔,或者使用一些命令行过滤来实现自动化(grep do_command…)。
Another challenge is that off-CPU stacks may be caused by involuntary context switching, as I described in Off-CPU Analysis Caveats. A solution on Linux is to filter the thread state to those of interest, for example, to only include the TASK_UNINTERRUPTIBLE state (2):
另一个挑战是,如我在off-CPU分析警告中所述,非自愿上下文切换可能会导致off-CPU堆栈。Linux上的一个解决方案是将线程状态过滤为感兴趣的状态,例如,只包括TASK_UNINTERRUPTIBLE状态(2):
# /usr/share/bcc/tools/offcputime -df -p `pgrep -nx mysqld` --state=2 30 > out.stacks
But a more difficult challenge is that the off-CPU stack traces often don’t explain what the performance problem is. In user-level, the stack may show that the application is blocked on file descriptor I/O, or waiting on a lock, but not why this took so much time. Kernel-level stacks can shed some more light, but these still can hit the same problem. The problem is that off-CPU stacks can be waiting on some other thread or resource to wake them up, and we’d like to know what that other thread or resources is, and why it took time.
但更困难的挑战是,cpu外堆栈跟踪通常不能解释性能问题是什么。在用户级,堆栈可能会显示应用程序在文件描述符I/O上被阻塞,或者等待锁,但不会显示为什么这花费了这么多时间。内核级堆栈可以提供更多的信息,但它们仍然会遇到相同的问题。问题是,非cpu堆栈可能会等待其他线程或资源来唤醒它们,我们想知道其他线程或资源是什么,以及为什么要花时间。
3. Wakeup
When a thread is off-CPU sleeping, it is eventually woken up. This is performed by another thread, the waker thread, and its stack trace can be interesting to examine and render as a flame graph. It often shows what took so long – what the sleeping thread was waiting on. This lets us solve more problems than off-CPU tracing alone, as the wakeup information can explain the real reason for blocking. This is especially helpful for lock contention, where the off-CPU path shows that we’re blocking on a lock but not why: who is holding the lock. The wakeup path can reveal who held and finally released the lock, causing the wakeup. As with tracing off-CPU events you need to be careful with the overheads, which can start to add up depending on the rate of events and tracer you use.
当线程脱离cpu处于睡眠状态时,它最终会被唤醒。这是由另一个线程waker线程执行的,它的堆栈跟踪可以作为火焰图进行检查和渲染。它经常显示什么花费了这么长时间——休眠线程在等待什么。这让我们解决了比单独的off-CPU跟踪更多的问题,因为唤醒信息可以解释阻塞的真正原因。这对于锁争用尤其有用,在这种情况下,off-CPU路径显示我们阻塞了一个锁,而不是为什么阻塞:谁持有锁。唤醒路径可以揭示谁持有锁并最终释放锁,从而导致唤醒。与跟踪cpu外事件一样,您需要注意开销,这取决于您使用的事件和跟踪程序的速率,开销可能会开始增加。
I wrote a tool to do this, wakeuptime in bcc/eBPF, which works like the following tracing pseudocode:
我写了一个工具来做到这一点,唤醒时间在bcc/eBPF,它的工作原理如下跟踪伪代码:
on context switch start:
sleeptime[thread_id] = timestamp
on wakeup:
if !sleeptime[target_thread_id]
return
delta = timestamp - sleeptime[target_thread_id]
totaltime[pid, execname, user stack, kernel stack, target_pid, target_execname] += delta
Here is sample output from wakeuptime:
下面是wakeuptime的输出示例:
# ./wakeuptime.py
Tracing blocked time (us) by kernel stack... Hit Ctrl-C to end.
^C
[...]
target: mysqld
ffffffff810013aa xen_hypercall_sched_op
ffffffff818ca709 xen_do_hypervisor_callback
ffffffff81522167 xen_evtchn_do_upcall
ffffffff815200dc __xen_evtchn_do_upcall
ffffffff81522a93 evtchn_2l_handle_events
ffffffff810d9a61 generic_handle_irq
ffffffff810decbd handle_percpu_irq
ffffffff810da880 handle_irq_event_percpu
ffffffff810da73b __handle_irq_event_percpu
ffffffff8101a8eb xen_timer_interrupt
ffffffff810f55f2 hrtimer_interrupt
ffffffff810f4efc __hrtimer_run_queues
ffffffff810f4c1e hrtimer_wakeup
waker: swapper/5
3500523
target: mysqld
ffffffff818c973b entry_SYSCALL_64_fastpath
ffffffff81776333 SYSC_sendto
ffffffff81775dd0 sock_sendmsg
ffffffff8184712e unix_stream_sendmsg
ffffffff8177978c sock_def_readable
ffffffff810bf80c __wake_up_common_lock
ffffffff810bf6f7 __wake_up_common
ffffffff81259805 pollwake
waker: sy**ench
35985186
[...]
Each output stack is intended to be read bottom-up. The first line shows the total time in microseconds spent in this wakeup path. The next, “waker:”, identifies the process name that did the wakeup, and is followed by the waker stack. Finally, on the top, “target:” identifies the process name of the thread that was woken up.
每个输出堆栈都是自底向上读取的。第一行显示在此唤醒路径上花费的总时间(以微秒为单位)。下一个是“waker:”,标识了进行唤醒的进程名,后面跟着waker堆栈。最后,在顶部,“target:”标识被唤醒的线程的进程名。
The bottom stack shows syench waking up mysqld via a socket sendmsg(). syench is a microbenchmark tool that is sending mysqld load. The top stack is harder to understand: it shows “swapper/5” (a kernel thread) waking up mysqld because of a timer interrupt (this is a cloud system under the Xen hypervisor). In reality, it could be a timer interrupt that has triggered processing of other pending interrupts, such as network I/O.
底部堆栈显示syench通过套接字sendmsg()唤醒mysqld。Syench是一个微基准测试工具,用来发送mysqld负载。顶部堆栈更难理解:它显示“swapper/5”(内核线程)由于计时器中断而唤醒mysqld(这是Xen管理程序下的云系统)。实际上,它可能是一个定时器中断,触发了其他暂挂中断的处理,比如网络I/O。
Here are the steps for creating a wakeup time flame graph with wakeuptime, tracing 30 seconds for the entire system:
以下是创建带有唤醒时间的唤醒时间火焰图的步骤,跟踪整个系统的30秒:
# /usr/share/bcc/tools/wakeuptime -f 30 > out.stacks
[...copy out.stacks to your local system if desired...]
# git clone https://github.com/brendangregg/FlameGraph
# cd FlameGraph
# ./flamegraph.pl --color=wakeup --title="Wakeup Time Flame Graph" --countname=us < out.stacks > out.svg
I’ve used a different color palette to differentiate that this showing wakeup time, rather than off-CPU time. It looks like this (SVG, PNG):
我使用了不同的调色板来区分这显示唤醒时间,而不是离开cpu时间。它看起来像这样(SVG, PNG):
This version of wakeuptime is showing kernel stacks only (a future version will show both kernel and user). This flame graph shows that mysqld was often wakeup up sy**ench, and vice versa.
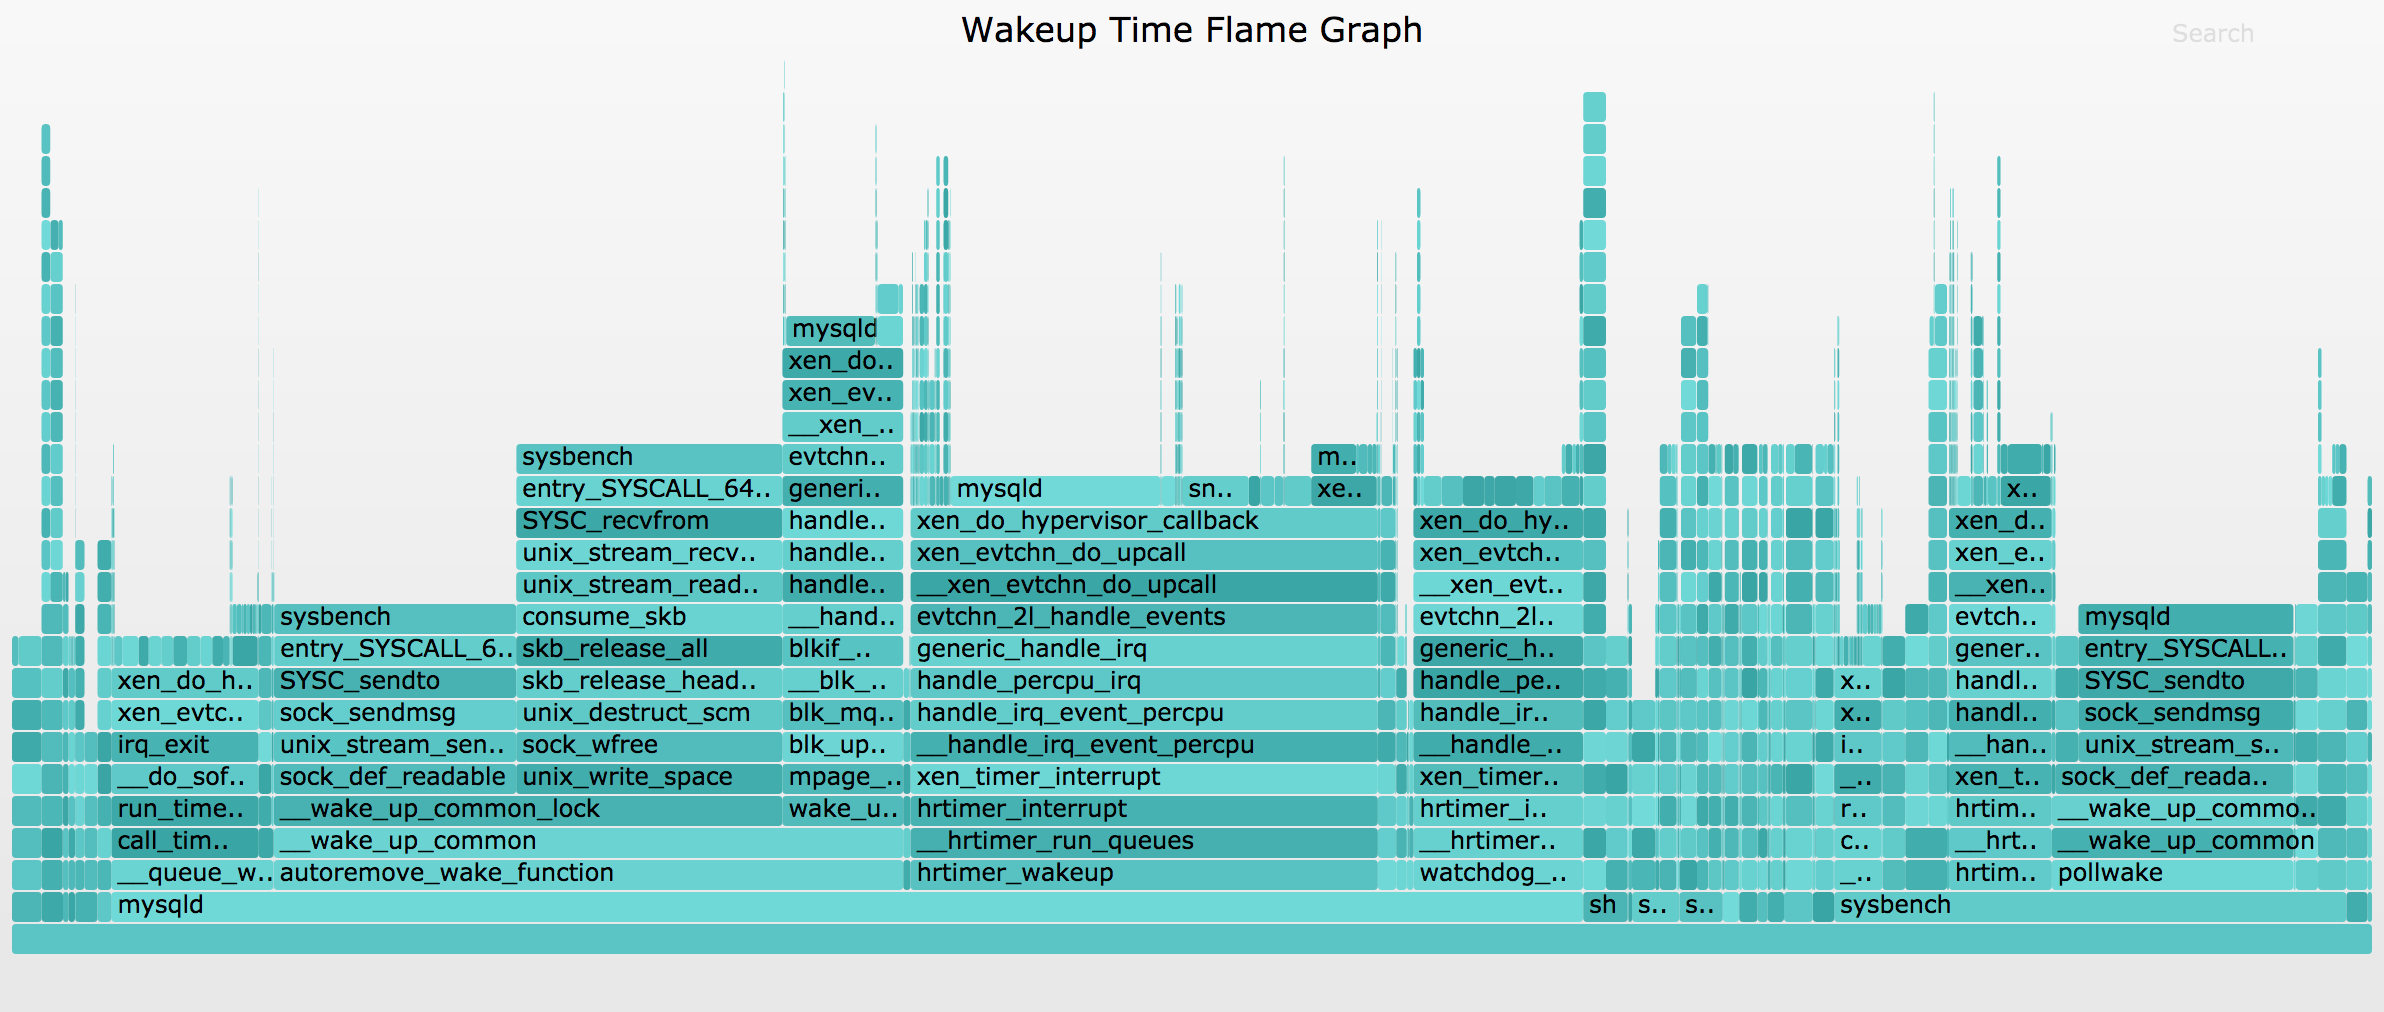
此版本的唤醒时间仅显示内核堆栈(未来版本将同时显示内核和用户)。这个火焰图显示mysqld经常被sy**ench唤醒,反之亦然。
So with both off-CPU and wakeup stack information, and some human navigation and cross-referencing, we can follow latency from the application down to metal. Would it be possible to programatically follow wakeups and objects, to build a chain of stacks from application latency to metal? And how could this be visualized?
因此,使用off-CPU和唤醒堆栈信息,以及一些人工导航和交叉引用,我们可以跟踪从应用程序到金属的延迟。是否有可能通过编程跟踪唤醒和对象,以构建从应用程序延迟到金属的堆栈链?这怎么能形象化呢?
4. Chain Graphs
Chain graphs are an experimental visualization that associates off-CPU stacks with their wakeup stacks, and those wakeup stacks with their wakeup stacks, and so on, following the full chain of wakeups. This is ambitious and may incur high overhead, but the payoff is a powerful tool for understanding all off-CPU events, regardless of wakeup chain complexity.
链图是一种实验可视化,它将非cpu堆栈与其唤醒堆栈相关联,将这些唤醒堆栈与其唤醒堆栈相关联,等等,遵循完整的唤醒链。这是雄心勃勃的,可能会产生很高的开销,但收益是一个强大的工具,用于理解所有脱离cpu的事件,而不考虑唤醒链的复杂性。
4.1. Off-Wake Flame Graphs
As an intermediate and more practical step, I began by associating off-CPU stacks with a single wakeup stack. This is my offwaketime bcc/eBPF tool. Alexei Starovoitov, eBPF creator, rewrote it in raw eBPF and added to the Linux kernel: offwaketime_kern.c and offwaketime_user.c. I first wrote about this tool in Linux Wakeup and Off-Wake Profiling, but that was before eBPF had stack trace support.
作为中间且更实用的步骤,我首先将非cpu堆栈与单个唤醒堆栈关联起来。这是我的offwaketime bcc/eBPF工具。eBPF的创建者Alexei Starovoitov用原始的eBPF重写了它,并添加到Linux内核:offwaketime_kern.c和offwaketime_user.c。我第一次在Linux唤醒和Off-Wake Profiling中写过这个工具,但那是在eBPF有堆栈跟踪支持之前。
Some output of offwaketime, tracing the entire system:
offwaketime的一些输出,跟踪整个系统:
# ./offwaketime.py
Tracing blocked time (us) by user + kernel off-CPU and waker stack... Hit Ctrl-C to end.
[...]
waker: swapper/1 0
xen_hypercall_sched_op
xen_do_hypervisor_callback
xen_evtchn_do_upcall
__xen_evtchn_do_upcall
evtchn_2l_handle_events
generic_handle_irq
handle_edge_irq
handle_irq_event
handle_irq_event_percpu
__handle_irq_event_percpu
blkif_interrupt
__blk_mq_complete_request
blk_mq_end_request
blk_update_request
mpage_end_io
wake_up_page_bit
__wake_up_common
autoremove_wake_function
-- --
finish_task_switch
__schedule
schedule
io_schedule
generic_file_read_iter
__vfs_read
vfs_read
SyS_pread64
entry_SYSCALL_64_fastpath
__GI___libc_pread
target: mysqld 18067
1324845
waker: mysqld 0
entry_SYSCALL_64_fastpath
SYSC_sendto
sock_sendmsg
unix_stream_sendmsg
sock_def_readable
__wake_up_common_lock
__wake_up_common
autoremove_wake_function
-- --
finish_task_switch
__schedule
schedule
schedule_timeout
unix_stream_read_generic
unix_stream_recvmsg
SYSC_recvfrom
entry_SYSCALL_64_fastpath
[unknown]
target: sy**ench 18106
1421478
[...]
I’ve tried a number of arrangements and found this to work best: you begin in the middle ("–") and read down for the off-CPU stack, and up for the waker stack which is in reverse order. I found this aids interpretation, as the stacks meet in the middle ("–") and you have the waker function adjacent to the sleeping function that it is waking up. And for both functions, you can read away from the middle to understand ancestry. Putting both stacks in the same order meant frequently visually hopping from the top of one stack to the top of another stack some distance away, which was harder to read.
我尝试了许多安排,发现这是最好的工作方式:你从中间(“——”)开始,对off-CPU堆栈向下读,对waker堆栈向上读,这是相反的顺序。我发现这有助于解释,因为堆栈在中间相遇(“——”),你有相邻的唤醒函数睡眠函数,它正在唤醒。对于这两个函数,你可以从中间开始读来了解祖先。将两个堆栈按相同的顺序排列意味着经常从一个堆栈的顶部跳到一段距离外的另一个堆栈的顶部,这很难阅读。
Here are the steps for creating a wakeup time flame graph with wakeuptime, tracing 30 seconds for the entire system:
以下是创建带有唤醒时间的唤醒时间火焰图的步骤,跟踪整个系统的30秒:
# /usr/share/bcc/tools/offwaketime -f 30 > out.stacks
[...copy out.stacks to your local system if desired...]
# git clone https://github.com/brendangregg/FlameGraph
# cd FlameGraph
# ./flamegraph.pl --color=chain --title="Off-Wake Time Flame Graph" --countname=us < out.stacks > out.svg
The off-wake palette switches from off-CPU colors to wakeup colors after the delimiter. The result looks like this (SVG, PNG):
off-wake调色板在分隔符之后从off-CPU颜色切换到唤醒颜色。结果如下所示(SVG, PNG):
You can browse this and more about the off-CPU stacks that we had been studying earlier. Zoom into the do_command() function (use Search on the top right, if you can’t find it) and you can see the block I/O completion interrupts waking up our vfs_read() stacks. This is really great.
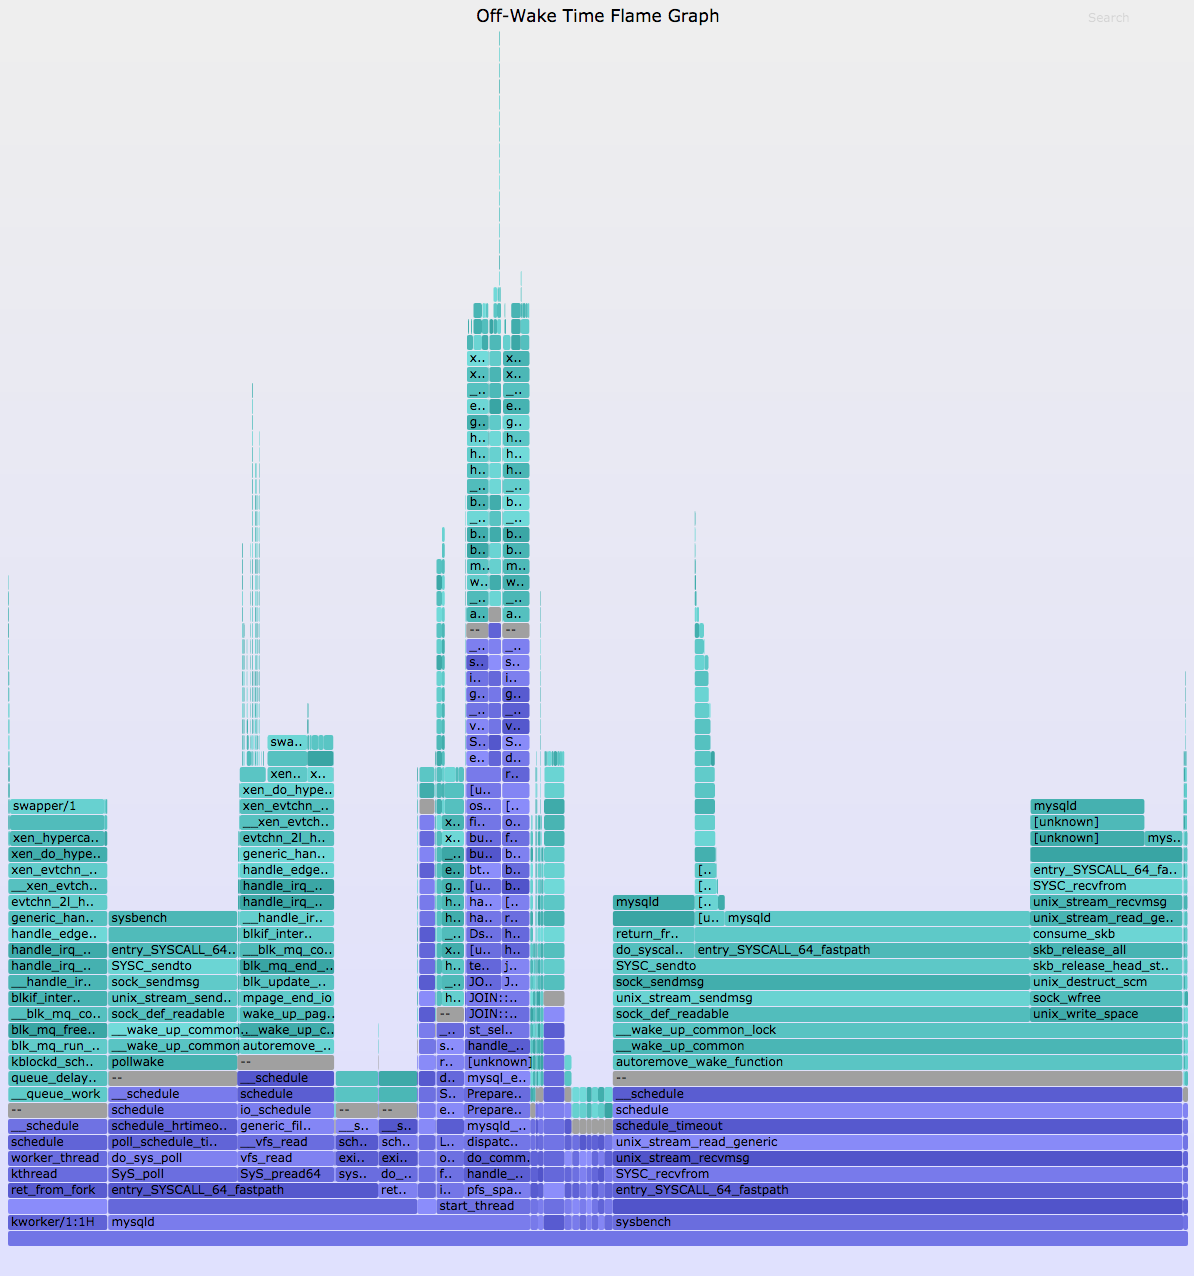
您可以浏览这篇文章以及关于我们之前研究过的非cpu堆栈的更多信息。放大do_command()函数(如果你找不到它,请使用右上方的Search),你可以看到块I/O完成中断唤醒了我们的vfs_read()堆栈。这真是太棒了。
4.2. Chain Graphs
In practice, I’ve found that off-CPU flame graphs only solve about 40% of issues: applications frequently block on locks or select/poll, and you need to know the waker to solve the issue. Off-wake flame graphs help, but I’ve found they only increase the successful win rate to about 70% of issues: sometimes one waker is not enough, and you need to know who it was woken up on. This is the role of chain graphs: to show the full wakeup chain.
在实践中,我发现off-CPU的火焰图只能解决大约40%的问题:应用程序经常阻塞锁或选择/轮询,您需要知道唤醒器来解决问题。Off-wake火焰图有帮助,但我发现它们只能将成功的胜率提高到70%:有时一个唤醒器是不够的,你需要知道它是在谁身上被唤醒的。这就是链图的作用:显示完整的唤醒链。
I first introduced chain graphs in my 2013 USENIX LISA plenary. Chain graphs are like off-wake flame graphs, but continue to add waker stacks on top of waker stacks. I more recently wrote about them in Linux chain graph prototype, where I implemented a prototype chain graph in eBPF and included the following legend to explain the ordering:
我第一次介绍链图是在2013年USENIX LISA全体会议上。链图类似于非唤醒火焰图,但是继续在唤醒堆栈上添加唤醒堆栈。我最近在Linux链图原型中写了关于它们的文章,我在eBPF中实现了一个原型链图,并包括下面的图例来解释顺序:
At the bottom is the off-CPU stack, with a gray frame on top. Above that are wakeup stacks in reverse order, as with off-wake flame graphs. Multiple wakeup stacks are separated by an additional gray frame.
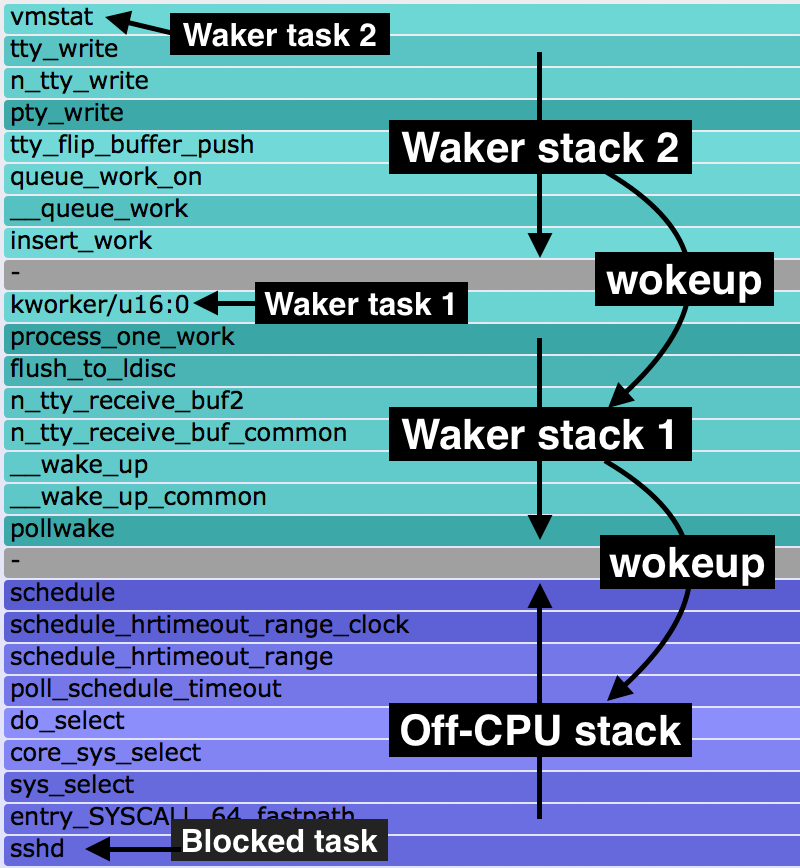
底部是非cpu堆栈,顶部有一个灰色框架。上面是倒序的唤醒堆栈,就像不唤醒火焰图一样。多个唤醒堆栈由一个额外的灰色框架分开。
This is how you read this:
你可以这样读:
- bottom-up: up to the first gray frame shows the code-path that led to a blocking and off-CPU event.
自下而上:直到第一个灰色帧显示了导致阻塞和off-CPU事件的代码路径。
- top-down: down to the bottom gray frame shows the chain of code-paths that led to wakeup up an off-CPU event.
自顶向下:直到底部的灰色框架显示了导致唤醒off-CPU事件的代码路径链。
I have a newer eBPF implementation of chain graphs that uses the 4.8 BPF stack support, which can walk more and deeper waker stacks. Eg, here’s a 6-level chain graph. I’m still working on challenges, though, such as wakeup loops on local systems, and overheads. Practically, off-wake time flame graphs may be as far as we usually take this. They are already provided by my offwaketime tool in bcc.
我有一个更新的eBPF链图实现,它使用4.8 BPF堆栈支持,它可以行走更多更深的waker堆栈。例如,这是一个6级链图。不过,我仍在处理一些挑战,比如本地系统上的唤醒循环,以及开销。实际上,不醒时火焰图可能是我们通常采取的。它们已经由我的offwaketime工具在密件抄送中提供了。
See the main Flame Graphs page for other types of flame graphs and links. There is also an older Solaris Off-CPU flame graphs page, which provides more examples (although a different OS). Also see my Off-CPU Analysis page for more discussion on off-CPU ****ysis as a methodology.
有关其他类型的火焰图和链接,请参阅主火焰图页面。还有一个较老的Solaris Off-CPU火焰图页面,其中提供了更多示例(尽管是不同的操作系统)。也可以查看我的Off-CPU Analysis页面,了解更多关于Off-CPU Analysis作为一种方**的讨论。