
Prometheus 服务完整部署原创
3年前
541924
1、 防火墙配置
2 、Exporter 节点配置
2 1、Linux 节点
2.2、Redis 节点
3 、Prometheus 环境配置
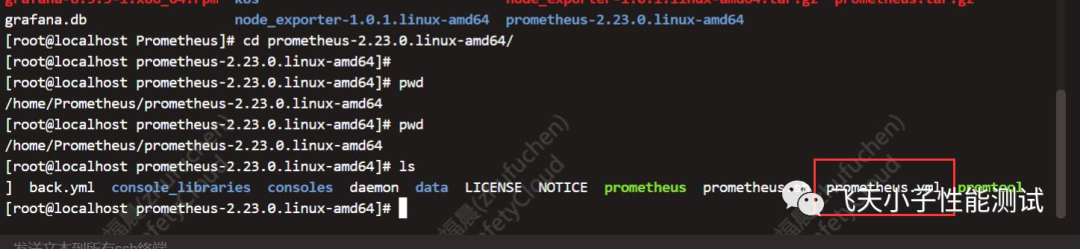
3.1 、 下载安装
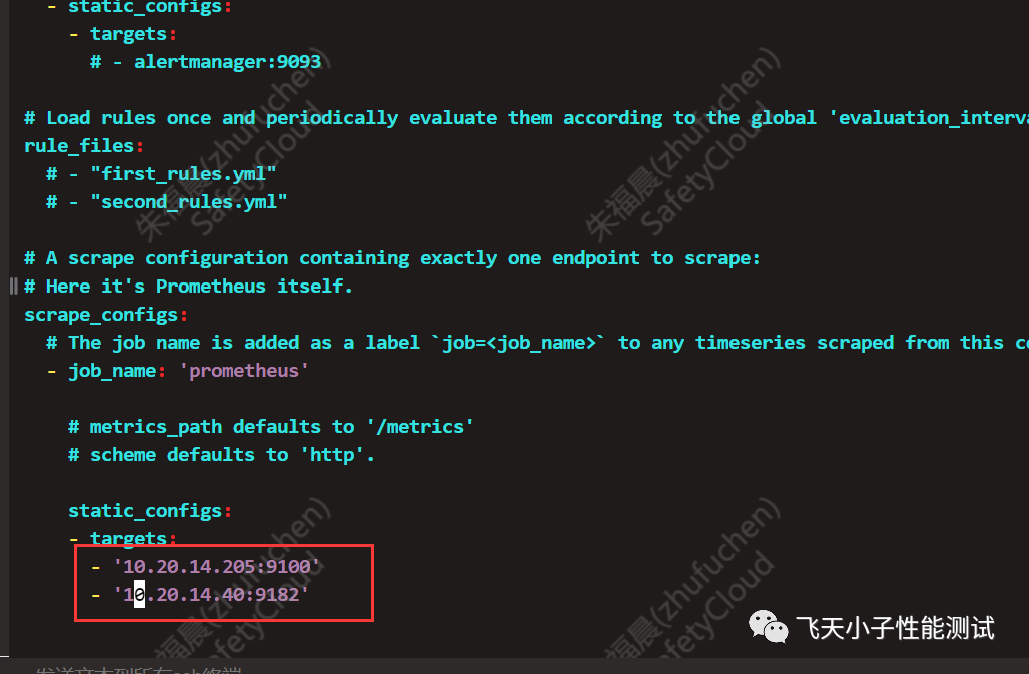
32、 配置文件
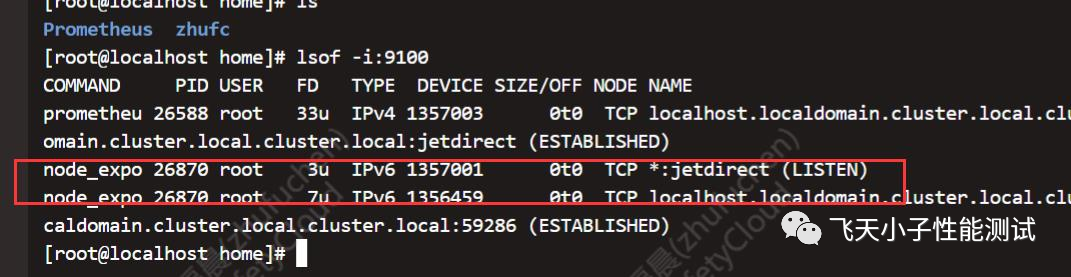
3.2.1 、节点监听
3.2.2 、杀死 进程
3.2.3 、重启进程
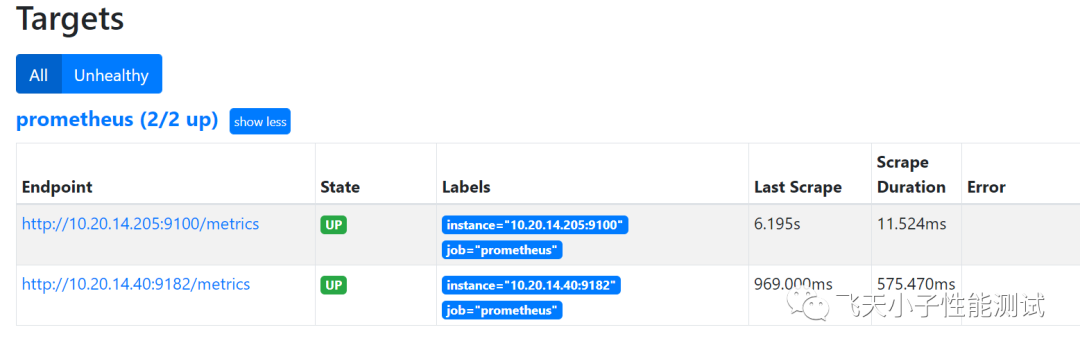
3.2.4 、节点管理
4 、Grafana 环境配置
4.1 、下载地址
4.1.1 、ubuntu 安装
4.1.2 、centos 版本
4.2 、服务启动
4.3 、日志查看
4.4、密码重置
点赞收藏
分类: