
一个 JVM 参数引发的频繁 CMS GC原创
前言
了解 CMS GC 的同学,一定知道 -XX:CMSScavengeBeforeRemark 参数,它是用来开启或关闭在 CMS-remark 阶段之前的清除(Young GC)尝试。
大家都知道CMS GC 只会回收 OldGen 的对象,那为什么需要这个参数?
由于 YoungGen 存在引用 OldGen 对象的情况,因此 CMS-remark 阶段会将 YoungGen 作为 OldGen 的 “GC ROOTS” 进行扫描,防止回收了不该回收的对象。而配置 -XX:+CMSScavengeBeforeRemark 参数,在 CMS GC 的 CMS-remark 阶段开始前先进行一次 Young GC,有利于减少 Young Gen 对 Old Gen 的无效引用,降低 CMS-remark 阶段的时间开销。
这篇文章的内容是业务开发同学遇到的奇怪的频繁 CMS GC 问题,我们一起定位排查,最终发现跟 -XX:CMSScavengeBeforeRemark 参数相关。
问题
频繁 Full GC
业务开发同学通过监控发现线上一台机器频繁 CMS GC,下图是 CMS GC 监控图,大约从 20 点 5-15 分,每分钟 8-11 次的持续 CMS GC。
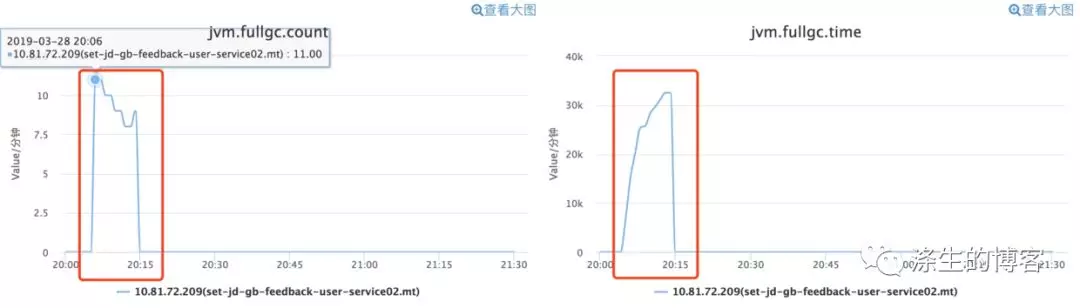
说明:公司监控对 Old GC 与 Full GC 是不区分的,案例中讲的其实是 CMS GC。
OldGen 使用空间占比
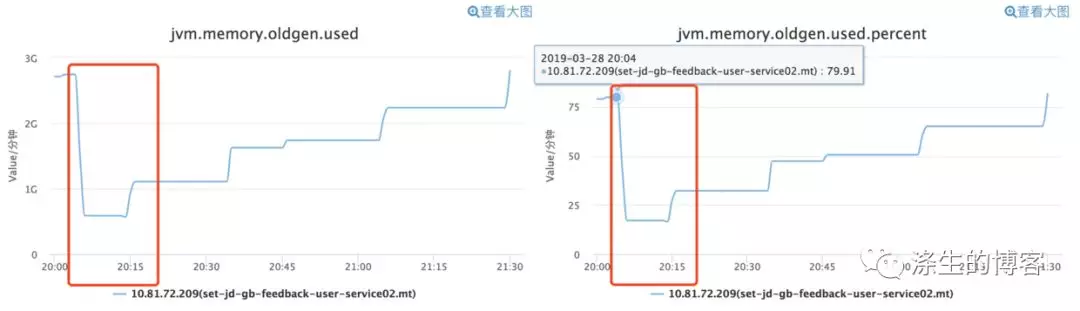
从下图 OldGen 的使用监控图来看,刚开始 OldGen 对象占用 OldGen 约 80% 的空间,经过 CMS GC 后,几乎立马空间使用的占用比例约在 30% 以下。
//JDK 版本 "1.8.0_45"
-Xms5324m -Xmx5324m -Xss512k -XX:PermSize=384m -XX:MaxPermSize=384m
-XX:MetaspaceSize=256m -XX:MaxMetaspaceSize=256m -XX:NewSize=2048m -XX:MaxNewSize=2048m
-XX:SurvivorRatio=8 -XX:MaxTenuringThreshold=9 -XX:+UseConcMarkSweepGC -XX:+UseCMSInitiatingOccupancyOnly
-XX:+CMSScavengeBeforeRemark -XX:+ScavengeBeforeFullGC -XX:+UseCMSCompactAtFullCollection -XX:+CMSParallelRemarkEnabled
-XX:CMSFullGCsBeforeCompaction=9 -XX:CMSInitiatingOccupancyFraction=80 -XX:+CMSClassUnloadingEnabled -XX:SoftRefLRUPolicyMSPerMB=0
-XX:-ReduceInitialCardMarks -XX:+CMSPermGenSweepingEnabled -XX:CMSInitiatingPermOccupancyFraction=80 -XX:+ExplicitGCInvokesConcurrent
-XX:+PrintGCDetails -XX:+PrintGCDateStamps -XX:+PrintGCApplicationConcurrentTime -XX:+PrintGCApplicationStoppedTime -XX:+PrintHeapAtGC
-Xloggc:/data/applogs/heap_trace.txt -XX:-HeapDumpOnOutOfMemoryError -XX:HeapDumpPath=/data/applogs/HeapDumpOnOutOfMemoryError
-XX:+IgnoreUnrecognizedVMOptions
结合 OldGen 的使用空间占比与 JVM 参数(-XX:+UseCMSInitiatingOccupancyOnly -XX:CMSInitiatingOccupancyFraction=80),几乎可以断定第一次 CMS GC 是因为 OldGen 的使用占比到达了 OldGen 总量的 80%。
疑惑
第一次触发 CMS GC 可以通过 OldGen 的使用占比到达了 OldGen 总量的 80% 来解释,但是通过监控可以看到后来 OldGen 使用占比降低到 30% 以下,为什么还一直频繁进行 CMS GC?
分析
GC 监控图展示的还不够全面,具体问题还是要通过 GC 日志进行定位,因为 GC 日志中的信息更丰富。
GC 日志
为了分析问题,这里选取了第一次、第二次、第三次-第 N 次的 CMS GC 日志。
第一次 CMS GC日志
2019-03-28T20:05:06.906+0800: 3644459.373: [GC (CMS Initial Mark) [1 CMS-initial-mark: 2935428K(3354624K)] 3160044K(5242112K), 0.0586708 secs] [Times: user=0.22 sys=0.00, real=0.06 secs]
2019-03-28T20:05:06.965+0800: 3644459.432: Total time for which application threads were stopped: 0.0616049 seconds, Stopping threads took: 0.0001381 seconds
2019-03-28T20:05:06.965+0800: 3644459.432: [CMS-concurrent-mark-start]
2019-03-28T20:05:08.066+0800: 3644460.533: [CMS-concurrent-mark: 1.101/1.101 secs] [Times: user=1.57 sys=0.05, real=1.10 secs]
2019-03-28T20:05:08.066+0800: 3644460.533: [CMS-concurrent-preclean-start]
2019-03-28T20:05:08.076+0800: 3644460.543: [CMS-concurrent-preclean: 0.010/0.010 secs] [Times: user=0.01 sys=0.01, real=0.01 secs]
2019-03-28T20:05:08.076+0800: 3644460.543: [CMS-concurrent-abortable-preclean-start]
2019-03-28T20:05:10.177+0800: 3644462.645: Application time: 3.2124140 seconds
{Heap before GC invocations=18476 (full 731):
par new generation total 1887488K, used 1887488K [0x0000000673400000, 0x00000006f3400000, 0x00000006f3400000)
eden space 1677824K, 100% used [0x0000000673400000, 0x00000006d9a80000, 0x00000006d9a80000)
from space 209664K, 100% used [0x00000006e6740000, 0x00000006f3400000, 0x00000006f3400000)
to space 209664K, 0% used [0x00000006d9a80000, 0x00000006d9a80000, 0x00000006e6740000)
concurrent mark-sweep generation total 3354624K, used 2935428K [0x00000006f3400000, 0x00000007c0000000, 0x00000007c0000000)
Metaspace used 90225K, capacity 91504K, committed 91776K, reserved 1130496K
class space used 9517K, capacity 9806K, committed 9856K, reserved 1048576K
2019-03-28T20:05:10.179+0800: 3644462.647: [GC (Allocation Failure) 3644462.647: [ParNew: 1887488K->201195K(1887488K), 0.4228807 secs] 4822916K->3279195K(5242112K), 0.4231546 secs] [Times: user=1.54 sys=0.00, real=0.42 secs]
Heap after GC invocations=18477 (full 731):
par new generation total 1887488K, used 201195K [0x0000000673400000, 0x00000006f3400000, 0x00000006f3400000)
eden space 1677824K, 0% used [0x0000000673400000, 0x0000000673400000, 0x00000006d9a80000)
from space 209664K, 95% used [0x00000006d9a80000, 0x00000006e5efae68, 0x00000006e6740000)
to space 209664K, 0% used [0x00000006e6740000, 0x00000006e6740000, 0x00000006f3400000)
concurrent mark-sweep generation total 3354624K, used 3078000K [0x00000006f3400000, 0x00000007c0000000, 0x00000007c0000000)
Metaspace used 90225K, capacity 91504K, committed 91776K, reserved 1130496K
class space used 9517K, capacity 9806K, committed 9856K, reserved 1048576K
}
2019-03-28T20:05:10.603+0800: 3644463.070: Total time for which application threads were stopped: 0.4258929 seconds, Stopping threads took: 0.0001722 seconds
2019-03-28T20:05:10.904+0800: 3644463.372: [CMS-concurrent-abortable-preclean: 2.397/2.828 secs] [Times: user=6.22 sys=0.10, real=2.83 secs]
2019-03-28T20:05:10.904+0800: 3644463.372: Application time: 0.3012271 seconds
2019-03-28T20:05:10.907+0800: 3644463.374: [GC (CMS Final Remark) [YG occupancy: 434406 K (1887488 K)]{Heap before GC invocations=18477 (full 731):
par new generation total 1887488K, used 434406K [0x0000000673400000, 0x00000006f3400000, 0x00000006f3400000)
eden space 1677824K, 13% used [0x0000000673400000, 0x00000006817bed10, 0x00000006d9a80000)
from space 209664K, 95% used [0x00000006d9a80000, 0x00000006e5efae68, 0x00000006e6740000)
to space 209664K, 0% used [0x00000006e6740000, 0x00000006e6740000, 0x00000006f3400000)
concurrent mark-sweep generation total 3354624K, used 3078000K [0x00000006f3400000, 0x00000007c0000000, 0x00000007c0000000)
Metaspace used 90225K, capacity 91504K, committed 91776K, reserved 1130496K
class space used 9517K, capacity 9806K, committed 9856K, reserved 1048576K
2019-03-28T20:05:10.907+0800: 3644463.375: [GC (CMS Final Remark) 3644463.375: [ParNew (promotion failed): 434406K->315478K(1887488K), 5.8407801 secs] 3512406K->3486710K(5242112K), 5.8410096 secs] [Times: user=6.84 sys=1.31, real=5.84 secs]
Heap after GC invocations=18478 (full 731):
par new generation total 1887488K, used 315478K [0x0000000673400000, 0x00000006f3400000, 0x00000006f3400000)
eden space 1677824K, 13% used [0x0000000673400000, 0x00000006817bed10, 0x00000006d9a80000)
from space 209664K, 39% used [0x00000006e6740000, 0x00000006eb796e60, 0x00000006f3400000)
to space 209664K, 95% used [0x00000006d9a80000, 0x00000006e5efae68, 0x00000006e6740000)
concurrent mark-sweep generation total 3354624K, used 3171231K [0x00000006f3400000, 0x00000007c0000000, 0x00000007c0000000)
Metaspace used 90225K, capacity 91504K, committed 91776K, reserved 1130496K
class space used 9517K, capacity 9806K, committed 9856K, reserved 1048576K
}
3644469.216: [Rescan (parallel) , 0.3096135 secs]3644469.525: [weak refs processing, 0.0009228 secs]3644469.526: [class unloading, 0.0797710 secs]3644469.606: [scrub symbol table, 0.0229535 secs]3644469.629: [scrub string table, 0.0020416 secs][1 CMS-remark: 3171231K(3354624K)] 3486710K(5242112K), 6.2593934 secs] [Times: user=8.10 sys=1.36, real=6.26 secs]
2019-03-28T20:05:17.166+0800: 3644469.634: Total time for which application threads were stopped: 6.2622888 seconds, Stopping threads took: 0.0002099 seconds
2019-03-28T20:05:17.167+0800: 3644469.634: [CMS-concurrent-sweep-start]
2019-03-28T20:05:17.176+0800: 3644469.644: Application time: 0.0100218 seconds
2019-03-28T20:05:17.179+0800: 3644469.647: Total time for which application threads were stopped: 0.0025500 seconds, Stopping threads took: 0.0001934 seconds
2019-03-28T20:05:18.179+0800: 3644470.647: Application time: 1.0001731 seconds
2019-03-28T20:05:18.182+0800: 3644470.649: Total time for which application threads were stopped: 0.0026811 seconds, Stopping threads took: 0.0001358 seconds
2019-03-28T20:05:21.000+0800: 3644473.468: Application time: 2.8185985 seconds
2019-03-28T20:05:21.003+0800: 3644473.471: Total time for which application threads were stopped: 0.0029238 seconds, Stopping threads took: 0.0001172 seconds
2019-03-28T20:05:21.013+0800: 3644473.481: Application time: 0.0097451 seconds
2019-03-28T20:05:21.019+0800: 3644473.487: Total time for which application threads were stopped: 0.0060990 seconds, Stopping threads took: 0.0002775 seconds
2019-03-28T20:05:21.734+0800: 3644474.201: Application time: 0.7144315 seconds
2019-03-28T20:05:21.736+0800: 3644474.204: Total time for which application threads were stopped: 0.0026804 seconds, Stopping threads took: 0.0001238 seconds
2019-03-28T20:05:22.203+0800: 3644474.671: [CMS-concurrent-sweep: 5.019/5.037 secs] [Times: user=5.28 sys=0.27, real=5.03 secs]
2019-03-28T20:05:22.204+0800: 3644474.671: [CMS-concurrent-reset-start]
2019-03-28T20:05:22.211+0800: 3644474.678: [CMS-concurrent-reset: 0.007/0.007 secs] [Times: user=0.01 sys=0.00, real=0.01 secs]
2019-03-28T20:05:22.238+0800: 3644474.706: Application time: 0.5016696 seconds
2019-03-28T20:05:22.241+0800: 3644474.708: Total time for which application threads were stopped: 0.0026876 seconds, Stopping threads took: 0.0001305 seconds
2019-03-28T20:05:22.438+0800: 3644474.905: Application time: 0.1970764 seconds
2019-03-28T20:05:22.440+0800: 3644474.908: Total time for which application threads were stopped: 0.0027034 seconds, Stopping threads took: 0.0001344 seconds
2019-03-28T20:05:23.441+0800: 3644475.908: Application time: 1.0001304 seconds
2019-03-28T20:05:23.443+0800: 3644475.911: Total time for which application threads were stopped: 0.0024875 seconds, Stopping threads took: 0.0001316 seconds
2019-03-28T20:05:24.210+0800: 3644476.678: Application time: 0.7671567 seconds
看第一次 CMS GC 日志,有以下四个发现:
-
由日志 “CMS-initial-mark: 2935428K(3354624K)”可知,第一次 CMS GC 是因为 2935428 / 3354624 = 87.5% > 80%,与此前监控图分析一致。
-
由日志 “2019-03-28T20:05:22.211+0800: 3644474.678: [CMS-concurrent-reset: 0.007/0.007 secs]” 可知,第一次 CMS GC 完成具体时间是 20:05:22.211。
-
由日志 “[GC (Allocation Failure) 3644462.647: [ParNew: 1887488K->201195K(1887488K), 0.4228807 secs]” 和日志 “[GC (CMS Final Remark) 3644463.375: [ParNew (promotion failed): 434406K->315478K(1887488K), 5.8407801 secs]”可知,第一次 CMS GC 日志中包含两次 Young GC,并且第一次 YoungGC 是由于 Allocation Failure,而第二次是因为什么呢,其实是因为配置了-XX:+CMSScavengeBeforeRemark 参数,因此在 CMS-remark 阶段前进行了一次 YoungGC。
-
除了以上的信息,还有个奇怪的现象是,Young GC 后 eden、from、to 三个 space 的使用量都不是 0 使用的情况,正常情况 Young GC 后 eden 和 to space 的使用量应该是 0。
这里其实不奇怪,通过日志 “concurrent mark-sweep generation total 3354624K, used 3171231K” 可知,OldGen 所剩无几,而且还可能存在碎片,这会导致 Young GC 晋升的对象,无处安放,导致 Young GC 回收停止了。
2019-03-28T20:05:10.907+0800: 3644463.375: [GC (CMS Final Remark) 3644463.375: [ParNew (promotion failed): 434406K->315478K(1887488K), 5.8407801 secs] 3512406K->3486710K(5242112K), 5.8410096 secs] [Times: user=6.84 sys=1.31, real=5.84 secs]
Heap after GC invocations=18478 (full 731):
par new generation total 1887488K, used 315478K [0x0000000673400000, 0x00000006f3400000, 0x00000006f3400000)
eden space 1677824K, 13% used [0x0000000673400000, 0x00000006817bed10, 0x00000006d9a80000)
from space 209664K, 39% used [0x00000006e6740000, 0x00000006eb796e60, 0x00000006f3400000)
to space 209664K, 95% used [0x00000006d9a80000, 0x00000006e5efae68, 0x00000006e6740000)
concurrent mark-sweep generation total 3354624K, used 3171231K [0x00000006f3400000, 0x00000007c0000000, 0x00000007c0000000)
Metaspace used 90225K, capacity 91504K, committed 91776K, reserved 1130496K
class space used 9517K, capacity 9806K, committed 9856K, reserved 1048576K
}
第二次 CMS GC 日志
2019-03-28T20:05:24.213+0800: 3644476.680: [GC (CMS Initial Mark) [1 CMS-initial-mark: 899032K(3354624K)] 1548664K(5242112K), 0.2663899 secs] [Times: user=0.82 sys=0.00, real=0.27 secs]
2019-03-28T20:05:24.479+0800: 3644476.947: Total time for which application threads were stopped: 0.2691825 seconds, Stopping threads took: 0.0001300 seconds
2019-03-28T20:05:24.480+0800: 3644476.947: [CMS-concurrent-mark-start]
2019-03-28T20:05:25.453+0800: 3644477.921: [CMS-concurrent-mark: 0.973/0.973 secs] [Times: user=0.98 sys=0.00, real=0.97 secs]
2019-03-28T20:05:25.453+0800: 3644477.921: [CMS-concurrent-preclean-start]
2019-03-28T20:05:25.463+0800: 3644477.931: [CMS-concurrent-preclean: 0.010/0.010 secs] [Times: user=0.01 sys=0.00, real=0.01 secs]
2019-03-28T20:05:25.463+0800: 3644477.931: [CMS-concurrent-abortable-preclean-start]
2019-03-28T20:05:25.463+0800: 3644477.931: [CMS-concurrent-abortable-preclean: 0.000/0.000 secs] [Times: user=0.00 sys=0.00, real=0.00 secs]
2019-03-28T20:05:25.464+0800: 3644477.931: Application time: 0.9841796 seconds
2019-03-28T20:05:25.466+0800: 3644477.934: [GC (CMS Final Remark) [YG occupancy: 649871 K (1887488 K)]{Heap before GC invocations=18478 (full 732):
par new generation total 1887488K, used 649871K [0x0000000673400000, 0x00000006f3400000, 0x00000006f3400000)
eden space 1677824K, 33% used [0x0000000673400000, 0x0000000695e4cfa0, 0x00000006d9a80000)
from space 209664K, 39% used [0x00000006e6740000, 0x00000006eb796e60, 0x00000006f3400000)
to space 209664K, 95% used [0x00000006d9a80000, 0x00000006e5efae68, 0x00000006e6740000)
concurrent mark-sweep generation total 3354624K, used 899032K [0x00000006f3400000, 0x00000007c0000000, 0x00000007c0000000)
Metaspace used 90199K, capacity 91456K, committed 91776K, reserved 1130496K
class space used 9512K, capacity 9798K, committed 9856K, reserved 1048576K
2019-03-28T20:05:25.466+0800: 3644477.934: [GC (CMS Final Remark) 3644477.934: [ParNew: 649871K->649871K(1887488K), 0.0000289 secs] 1548903K->1548903K(5242112K), 0.0001785 secs] [Times: user=0.00 sys=0.00, real=0.00 secs]
Heap after GC invocations=18479 (full 732):
par new generation total 1887488K, used 649871K [0x0000000673400000, 0x00000006f3400000, 0x00000006f3400000)
eden space 1677824K, 33% used [0x0000000673400000, 0x0000000695e4cfa0, 0x00000006d9a80000)
from space 209664K, 39% used [0x00000006e6740000, 0x00000006eb796e60, 0x00000006f3400000)
to space 209664K, 95% used [0x00000006d9a80000, 0x00000006e5efae68, 0x00000006e6740000)
concurrent mark-sweep generation total 3354624K, used 899032K [0x00000006f3400000, 0x00000007c0000000, 0x00000007c0000000)
Metaspace used 90199K, capacity 91456K, committed 91776K, reserved 1130496K
class space used 9512K, capacity 9798K, committed 9856K, reserved 1048576K
}
3644477.934: [Rescan (parallel) , 0.6932186 secs]3644478.627: [weak refs processing, 0.0000973 secs]3644478.628: [class unloading, 0.0527698 secs]3644478.680: [scrub symbol table, 0.0170169 secs]3644478.697: [scrub string table, 0.0019041 secs][1 CMS-remark: 899032K(3354624K)] 1548903K(5242112K), 0.7680979 secs] [Times: user=2.75 sys=0.00, real=0.76 secs]
2019-03-28T20:05:26.234+0800: 3644478.702: Total time for which application threads were stopped: 0.7708180 seconds, Stopping threads took: 0.0001262 seconds
2019-03-28T20:05:26.235+0800: 3644478.703: [CMS-concurrent-sweep-start]
2019-03-28T20:05:27.235+0800: 3644479.702: Application time: 1.0001322 seconds
2019-03-28T20:05:27.237+0800: 3644479.705: Total time for which application threads were stopped: 0.0026851 seconds, Stopping threads took: 0.0001390 seconds
2019-03-28T20:05:27.441+0800: 3644479.908: Application time: 0.2034629 seconds
2019-03-28T20:05:27.445+0800: 3644479.912: Total time for which application threads were stopped: 0.0038960 seconds, Stopping threads took: 0.0014157 seconds
2019-03-28T20:05:28.445+0800: 3644480.912: Application time: 1.0001430 seconds
2019-03-28T20:05:28.447+0800: 3644480.915: Total time for which application threads were stopped: 0.0026665 seconds, Stopping threads took: 0.0001339 seconds
2019-03-28T20:05:31.156+0800: 3644483.624: Application time: 2.7089917 seconds
2019-03-28T20:05:31.159+0800: 3644483.627: Total time for which application threads were stopped: 0.0025883 seconds, Stopping threads took: 0.0001411 seconds
2019-03-28T20:05:32.468+0800: 3644484.936: [CMS-concurrent-sweep: 6.221/6.233 secs] [Times: user=6.35 sys=0.06, real=6.24 secs]
2019-03-28T20:05:32.468+0800: 3644484.936: [CMS-concurrent-reset-start]
2019-03-28T20:05:32.476+0800: 3644484.943: [CMS-concurrent-reset: 0.007/0.007 secs] [Times: user=0.01 sys=0.00, real=0.00 secs]
2019-03-28T20:05:33.159+0800: 3644485.627: Application time: 2.0002143 seconds
2019-03-28T20:05:33.162+0800: 3644485.630: Total time for which application threads were stopped: 0.0026832 seconds, Stopping threads took: 0.0001180 seconds
2019-03-28T20:05:34.162+0800: 3644486.630: Application time: 1.0000781 seconds
2019-03-28T20:05:34.164+0800: 3644486.632: Total time for which application threads were stopped: 0.0023807 seconds, Stopping threads took: 0.0001220 seconds
2019-03-28T20:05:34.476+0800: 3644486.943: Application time: 0.3111430 seconds
看第二次 CMS GC 日志,有以下四个发现:
-
由日志 “CMS-initial-mark: 899032K(3354624K)” 可知,其实第一次 CMS GC 是已经回收了 OldGen,而且释放了大量空间,OldGen 的使用占比只有 899032 / 3354624 = 26.8%,很奇怪为什么会进行 CMS GC?
-
由日志 “2019-03-28T20:05:24.213+0800: 3644476.680: [GC (CMS Initial Mark)” 可知,第二次 CMS GC 开始的具体时间是 20:05:24.213,上次 CMS GC 结束时间 20:05:22.211 相差 2s。
-
由日志 “[GC (CMS Final Remark) 3644477.934: [ParNew: 649871K->649871K(1887488K), 0.0000289 secs]” 可知,第二次 CMS GC 日志中包含一次 Young GC,毫无疑问是因为配置了-XX:+CMSScavengeBeforeRemark 参数导致的。
-
Young GC 后 eden、from、to 三个 space 的使用量都不是 0 的情况依然存在,只是 eden space 由使用比率 13% 增加到 33%。
很奇怪,此时通过日志 “concurrent mark-sweep generation total 3354624K, used 899032K” 可知,OldGen 空闲空间很大,为什么 Young GC 好像没起作用。
Heap after GC invocations=18479 (full 732):
par new generation total 1887488K, used 649871K [0x0000000673400000, 0x00000006f3400000, 0x00000006f3400000)
eden space 1677824K, 33% used [0x0000000673400000, 0x0000000695e4cfa0, 0x00000006d9a80000)
from space 209664K, 39% used [0x00000006e6740000, 0x00000006eb796e60, 0x00000006f3400000)
to space 209664K, 95% used [0x00000006d9a80000, 0x00000006e5efae68, 0x00000006e6740000)
concurrent mark-sweep generation total 3354624K, used 899032K [0x00000006f3400000, 0x00000007c0000000, 0x00000007c0000000)
Metaspace used 90199K, capacity 91456K, committed 91776K, reserved 1130496K
class space used 9512K, capacity 9798K, committed 9856K, reserved 1048576K
}
第三次-第 N 次 CMS GC 日志
2019-03-28T20:05:34.478+0800: 3644486.945: [GC (CMS Initial Mark) [1 CMS-initial-mark: 573449K(3354624K)] 1247191K(5242112K), 0.5737527 secs] [Times: user=0.79 sys=0.00, real=0.57 secs]
2019-03-28T20:05:35.052+0800: 3644487.519: Total time for which application threads were stopped: 0.5762441 seconds, Stopping threads took: 0.0001088 seconds
2019-03-28T20:05:35.052+0800: 3644487.520: [CMS-concurrent-mark-start]
......
......
看第三次-第 N 次 CMS GC 日志,有三个发现:
-
由日志 “CMS-initial-mark: 573449K(3354624K)” 可知,OldGen 的使用占比只有 573449 / 3354624= 17.1%,很奇怪为什么会进行 CMS GC?
-
由日志 “2019-03-28T20:05:34.478+0800: 3644486.945: [GC (CMS Initial Mark)” 可知,第三次 CMS GC 的开始时间 20:05:34.478 与 第二次 CMS GC 结束时间 20:05:32.476 又相差 2s。
-
由于配置了 -XX:+CMSScavengeBeforeRemark 参数,CMS GC 过程中依然包含一次 Young GC。
-
Young GC 后 eden、from、to 三个 space 的使用量都不是 0 的情况依然存在,只是 eden space 由使用比率增长。 很奇怪,OldGen 空闲空间很大,为什么 Young GC 好像没起作用?
根源定位
通过日志分析,,大家很容易发现三个问题:
每次 CMS GC 都是相隔 2s?
这其实是 CMS background collector 的策略,每隔 CMSWaitDuration(默认为2000ms) 时间进行一次检测,若发现满足 CMS GC 触发条件,就进行一次 CMS background collector。
第二次及后面的 CMS GC,OldGen 的使用占比情况都没有达到 80%,很疑惑是什么导致了 CMS GC?
通过上面的分析,其实只要知道是什么满足了 CMS GC 触发条件而导致了 CMS GC,就能回答第二个问题。
Young GC 后 eden、from、to 三个 space 的使用量都不是 0 的情况,而且 OldGen 空闲空间很大,为什么 Young GC 好像没起作用。
源码排查
OldGen 的使用占比情况都没有达到 80%,什么原因导致的 CMS GC
下面我们来看下 CMS GC 触发条件,触发条件都在 shouldConcurrentCollect 函数里,返回 true 的都是可能的情况,这里分别解释下。
-
“if (fullgc_requested)”
这是由 System.gc() 调用且配置了 -XX:+ExplicitGCInvokesConcurrent 参数的情况下,会触发一次 CMS GC。但如果是 System.gc(),每次 CMS GC 的间隔时间不可能一直是 2s,故显然不符合。 -
“if (!UseCMSInitiatingOccupancyOnly)”
这是在没有配置 -XX:+UseCMSInitiatingOccupancyOnly 参数的情况下,可能触发 CMS GC 的情况,故显然不符合。 -
“if (cmsGen->shouldconcurrent_collect())”
这是 -XX:+UseCMSInitiatingOccupancyOnly 参数的情况下,如果 OldGen 使用占比达到 -XX:CMSInitiatingOccupancyFraction 参数设置值,就会触发 CMS GC,但第二次、第三-第 N 次明显不符合情况。 -
“if (gch->incrementalcollectionwillfail(true /* consultyoung */))”
这是一种悲观策略,判断新生代回收是否会失败,如果最近一次 Young GC 已经失败或者可能会失败,就会触发一次 CMS GC。这是符合本文说的情况的。 -
“if (MetaspaceGC::shouldconcurrentcollect())”
这是 Metaspace 满足 CMS GC 触发条件的情况,根据日志 “ Metaspace used 90199K, capacity 91456K, committed 91776K, reserved 1130496K” 中 Metaspace 空间使用情况,显然不符合。 -
“if (CMSTriggerInterval >= 0)”
这是配置了 -XX:CMSTriggerInterval 参数的情况,显然不符合。
bool CMSCollector::shouldConcurrentCollect() {
LogTarget(Trace, gc) log;
if (_full_gc_requested) {
log.print("CMSCollector: collect because of explicit gc request (or GCLocker)");
return true;
}
FreelistLocker x(this);
// ------------------------------------------------------------------
// Print out lots of information which affects the initiation of
// a collection.
if (log.is_enabled() && stats().valid()) {
log.print("CMSCollector shouldConcurrentCollect: ");
LogStream out(log);
stats().print_on(&out);
log.print("time_until_cms_gen_full %3.7f", stats().time_until_cms_gen_full());
log.print("free=" SIZE_FORMAT, _cmsGen->free());
log.print("contiguous_available=" SIZE_FORMAT, _cmsGen->contiguous_available());
log.print("promotion_rate=%g", stats().promotion_rate());
log.print("cms_allocation_rate=%g", stats().cms_allocation_rate());
log.print("occupancy=%3.7f", _cmsGen->occupancy());
log.print("initiatingOccupancy=%3.7f", _cmsGen->initiating_occupancy());
log.print("cms_time_since_begin=%3.7f", stats().cms_time_since_begin());
log.print("cms_time_since_end=%3.7f", stats().cms_time_since_end());
log.print("metadata initialized %d", MetaspaceGC::should_concurrent_collect());
}
// ------------------------------------------------------------------
// If the estimated time to complete a cms collection (cms_duration())
// is less than the estimated time remaining until the cms generation
// is full, start a collection.
if (!UseCMSInitiatingOccupancyOnly) {
if (stats().valid()) {
if (stats().time_until_cms_start() == 0.0) {
return true;
}
} else {
// We want to conservatively collect somewhat early in order
// to try and "bootstrap" our CMS/promotion statistics;
// this branch will not fire after the first successful CMS
// collection because the stats should then be valid.
if (_cmsGen->occupancy() >= _bootstrap_occupancy) {
log.print(" CMSCollector: collect for bootstrapping statistics: occupancy = %f, boot occupancy = %f",
_cmsGen->occupancy(), _bootstrap_occupancy);
return true;
}
}
}
// Otherwise, we start a collection cycle if
// old gen want a collection cycle started. Each may use
// an appropriate criterion for making this decision.
// XXX We need to make sure that the gen expansion
// criterion dovetails well with this. XXX NEED TO FIX THIS
if (_cmsGen->should_concurrent_collect()) {
log.print("CMS old gen initiated");
return true;
}
// We start a collection if we believe an incremental collection may fail;
// this is not likely to be productive in practice because it's probably too
// late anyway.
GenCollectedHeap* gch = GenCollectedHeap::heap();
assert(gch->collector_policy()->is_generation_policy(),
"You may want to check the correctness of the following");
if (gch->incremental_collection_will_fail(true /* consult_young */)) {
log.print("CMSCollector: collect because incremental collection will fail ");
return true;
}
if (MetaspaceGC::should_concurrent_collect()) {
log.print("CMSCollector: collect for metadata allocation ");
return true;
}
// CMSTriggerInterval starts a CMS cycle if enough time has passed.
if (CMSTriggerInterval >= 0) {
if (CMSTriggerInterval == 0) {
// Trigger always
return true;
}
// Check the CMS time since begin (we do not check the stats validity
// as we want to be able to trigger the first CMS cycle as well)
if (stats().cms_time_since_begin() >= (CMSTriggerInterval / ((double) MILLIUNITS))) {
if (stats().valid()) {
log.print("CMSCollector: collect because of trigger interval (time since last begin %3.7f secs)",
stats().cms_time_since_begin());
} else {
log.print("CMSCollector: collect because of trigger interval (first collection)");
}
return true;
}
}
return false;
}
接下来,我们具体分析下 incrementalcollectionwillfail(true) 函数,这个函数有两个判断条件 incrementalcollectionfailed() 或者 !younggen->collectionattemptissafe(),有一个成立就会返回 true。
// Returns true if an incremental collection is likely to fail.
// We optionally consult the young gen, if asked to do so;
// otherwise we base our answer on whether the previous incremental
// collection attempt failed with no corrective action as of yet.
bool incremental_collection_will_fail(bool consult_young) {
// The first disjunct remembers if an incremental collection failed, even
// when we thought (second disjunct) that it would not.
return incremental_collection_failed() ||
(consult_young && !_young_gen->collection_attempt_is_safe());
}
bool incremental_collection_failed() const {
return _incremental_collection_failed;
}
我们先来看 incrementalcollectionfailed() 函数,这个函数返回的是incrementalcollectionfailed 这个成员的值,这个值只有两个情况下会通过 setincrementalcollectionfailed() 函数设置成 true,并且会在 CMS GC 的 sweep 阶段会设置为 false。
第一种情况是:
晋升失败 Promotion failed,但是只有第一次 CMS GC 出现过一次,后续的Young GC 都不是 promotion failed,说明不是这种情况。
void ParNewGeneration::handle_promotion_failed(GenCollectedHeap* gch, ParScanThreadStateSet& thread_state_set) {
assert(_promo_failure_scan_stack.is_empty(), "post condition");
_promo_failure_scan_stack.clear(true); // Clear cached segments.
remove_forwarding_pointers();
log_info(gc, promotion)("Promotion failed");
// All the spaces are in play for mark-sweep.
swap_spaces(); // Make life simpler for CMS || rescan; see 6483690.
from()->set_next_compaction_space(to());
gch->set_incremental_collection_failed();
// Inform the next generation that a promotion failure occurred.
_old_gen->promotion_failure_occurred();
// Trace promotion failure in the parallel GC threads
thread_state_set.trace_promotion_failed(gc_tracer());
// Single threaded code may have reported promotion failure to the global state
if (_promotion_failed_info.has_failed()) {
_gc_tracer.report_promotion_failed(_promotion_failed_info);
}
// Reset the PromotionFailureALot counters.
NOT_PRODUCT(gch->reset_promotion_should_fail();)
}
第二种情况是:
Young GC 过程中,if (!collectionattemptissafe()) 为 true,也会通过 setincrementalcollectionfailed() 函数设置。
void ParNewGeneration::collect(bool full,
bool clear_all_soft_refs,
size_t size,
bool is_tlab) {
assert(full || size > 0, "otherwise we don't want to collect");
GenCollectedHeap* gch = GenCollectedHeap::heap();
_gc_timer->register_gc_start();
AdaptiveSizePolicy* size_policy = gch->gen_policy()->size_policy();
WorkGang* workers = gch->workers();
assert(workers != NULL, "Need workgang for parallel work");
uint active_workers =
AdaptiveSizePolicy::calc_active_workers(workers->total_workers(),
workers->active_workers(),
Threads::number_of_non_daemon_threads());
active_workers = workers->update_active_workers(active_workers);
log_info(gc,task)("Using %u workers of %u for evacuation", active_workers, workers->total_workers());
_old_gen = gch->old_gen();
// If the next generation is too full to accommodate worst-case promotion
// from this generation, pass on collection; let the next generation
// do it.
if (!collection_attempt_is_safe()) {
gch->set_incremental_collection_failed(); // slight lie, in that we did not even attempt one
return;
}
我们再看看 collectionattemptissafe() 函数的实现,会让你豁然开朗,if (!to()->isempty()) return false,刚好满足了每次 YoungGC to space 不为空。因此,是在这里 incrementalcollection_failed 被设置成 true,导致每隔 2s 触发一次 CMS GC,这就解释了为什么 OldGen 的使用占比情况都没有达到 80%,也会触发 CMS GC。
bool DefNewGeneration::collection_attempt_is_safe() {
if (!to()->is_empty()) {
log_trace(gc)(":: to is not empty ::");
return false;
}
if (_old_gen == NULL) {
GenCollectedHeap* gch = GenCollectedHeap::heap();
_old_gen = gch->old_gen();
}
return _old_gen->promotion_attempt_is_safe(used());
}
Young GC 后 eden、from、to 三个 space 的使用量都不是 0 的情况
看到这里,其实这个问题也很好解释了,我们看 ParNewGeneration::collect 函数中的这段代码就明白了,YoungGC 遇到 to space 不为空的情况下,直接 setincrementalcollection_failed() 完就返回了,并没有进行真正的 Young GC。
if (!collection_attempt_is_safe()) {
gch->set_incremental_collection_failed(); // slight lie, in that we did not even attempt one
return;
}
罪魁祸首
看到这里,你一定在想,那罪魁祸首到底是谁呢?表面上看是 to space 不为空导致触发了 Young GC,然后设置了 incrementalcollectionfailed 参数,进而满足了 CMS GC 触发条件。实质上是因为配置了 -XX:CMSScavengeBeforeRemark 参数,CMS GC 阶段强制进行了 Young GC,导致 to space 不为空,因此这个锅得由 -XX:CMSScavengeBeforeRemark 参数来背。
你可能要问即使不设置 -XX:CMSScavengeBeforeRemark 参数 CMS GC 阶段也是有可能会触发 Young GC,凭什么要让 -XX:CMSScavengeBeforeRemark 参数来背锅。
如果是 Allocation Failure 触发的 Young GC 也会有问题吗?
答案是不会,这里可以借助最后一次 CMS GC 日志来分析。
最后一次 CMS GC 日志
2019-03-28T20:14:15.470+0800: 3645007.937: Application time: 2.4315795 seconds
2019-03-28T20:14:15.472+0800: 3645007.940: [GC (CMS Initial Mark) [1 CMS-initial-mark: 572987K(3354624K)] 2318654K(5242112K), 1.7733417 secs] [Times: user=1.94 sys=0.05, real=1.77 secs]
2019-03-28T20:14:17.246+0800: 3645009.714: Total time for which application threads were stopped: 1.7762440 seconds, Stopping threads took: 0.0001283 seconds
2019-03-28T20:14:17.246+0800: 3645009.714: [CMS-concurrent-mark-start]
2019-03-28T20:14:17.257+0800: 3645009.725: Application time: 0.0112116 seconds
2019-03-28T20:14:17.260+0800: 3645009.728: Total time for which application threads were stopped: 0.0027625 seconds, Stopping threads took: 0.0001346 seconds
2019-03-28T20:14:17.260+0800: 3645009.728: Application time: 0.0001755 seconds
2019-03-28T20:14:17.263+0800: 3645009.730: Total time for which application threads were stopped: 0.0027375 seconds, Stopping threads took: 0.0000825 seconds
2019-03-28T20:14:17.263+0800: 3645009.731: Application time: 0.0000958 seconds
2019-03-28T20:14:17.265+0800: 3645009.733: Total time for which application threads were stopped: 0.0025920 seconds, Stopping threads took: 0.0000832 seconds
2019-03-28T20:14:17.274+0800: 3645009.741: Application time: 0.0081685 seconds
2019-03-28T20:14:17.277+0800: 3645009.744: Total time for which application threads were stopped: 0.0028536 seconds, Stopping threads took: 0.0001305 seconds
2019-03-28T20:14:17.845+0800: 3645010.312: Application time: 0.5681527 seconds
{Heap before GC invocations=18561 (full 815):
par new generation total 1887488K, used 1760091K [0x0000000673400000, 0x00000006f3400000, 0x00000006f3400000)
eden space 1677824K, 100% used [0x0000000673400000, 0x00000006d9a80000, 0x00000006d9a80000)
from space 209664K, 39% used [0x00000006e6740000, 0x00000006eb796e60, 0x00000006f3400000)
to space 209664K, 95% used [0x00000006d9a80000, 0x00000006e5efae68, 0x00000006e6740000)
concurrent mark-sweep generation total 3354624K, used 572987K [0x00000006f3400000, 0x00000007c0000000, 0x00000007c0000000)
Metaspace used 90185K, capacity 91432K, committed 91776K, reserved 1130496K
class space used 9510K, capacity 9794K, committed 9856K, reserved 1048576K
2019-03-28T20:14:17.847+0800: 3645010.315: [GC (Allocation Failure) 3645010.315: [ParNew: 1760091K->1760091K(1887488K), 0.0000231 secs]3645010.315: [CMS2019-03-28T20:14:18.223+0800: 3645010.691: [CMS-concurrent-mark: 0.961/0.977 secs] [Times: user=1.04 sys=0.00, real=0.97 secs]
(concurrent mode failure): 572987K->554147K(3354624K), 3.2531090 secs] 2333078K->554147K(5242112K), [Metaspace: 90185K->90185K(1130496K)], 3.2534483 secs] [Times: user=3.26 sys=0.00, real=3.25 secs]
Heap after GC invocations=18562 (full 816):
new generation total 1887488K, used 0K [0x0000000673400000, 0x00000006f3400000, 0x00000006f3400000)
eden space 1677824K, 0% used [0x0000000673400000, 0x0000000673400000, 0x00000006d9a80000)
from space 209664K, 0% used [0x00000006e6740000, 0x00000006e6740000, 0x00000006f3400000)
to space 209664K, 0% used [0x00000006d9a80000, 0x00000006d9a80000, 0x00000006e6740000)
concurrent mark-sweep generation total 3354624K, used 554147K [0x00000006f3400000, 0x00000007c0000000, 0x00000007c0000000)
Metaspace used 90165K, capacity 91402K, committed 91776K, reserved 1130496K
class space used 9507K, capacity 9789K, committed 9856K, reserved 1048576K
}
2019-03-28T20:14:21.101+0800: 3645013.568: Total time for which application threads were stopped: 3.2561084 seconds, Stopping threads took: 0.0001151 seconds
看上面的日志,你会发现这次 CMS GC 日志跟以往的都不太一样,CMS-concurrent-mark-start 日志出现后,后面的日志都不是按照 CMS GC 的各个阶段打出来的。
是的,后面其实是由于 Allocation Failure 而发生了一次 Young GC,从而中断了 CMS background collector,而进行了一次 CMS foreground collector,有 “concurrent mode failure” 为证。
也就是说一般的 Allocation Failure 引起的 YoungGC 在这种情况下,不会出现频繁 CMS GC,因此,把问题归结到 -XX:CMSScavengeBeforeRemark 参数不为过吧。
总结
本文主要是由于 -XX:CMSScavengeBeforeRemark 参数触发了 Young GC,但该 YoungGC 并没有成功进行的,反而促使 CMS background collector 触发条件满足,进而引发了频繁 CMS GC。
该怎么避免呢
一时也没有想到很好的办法,两个参考方案:
-
去掉 -XX:CMSScavengeBeforeRemark 参数
-
降低 YoungGen 大小,加快因 Allocation Failure 而触发正常 Young GC