
美团海量连接服务端jvm参数调优分享原创
应用:shark-新美大移动端网络优化(每日接受移动端请求约150亿)
应用特点:
- qps比较高,新生代增长飞快
- 用户的连接需要维持一段时间
- 单机需要维持海量连接,几十万的级别
以上三个特点导致有大量小对象聚集在old区,高峰期old区域增长非常快,对象在一段时间内肯定会消亡
初始的线上gc的情况如下
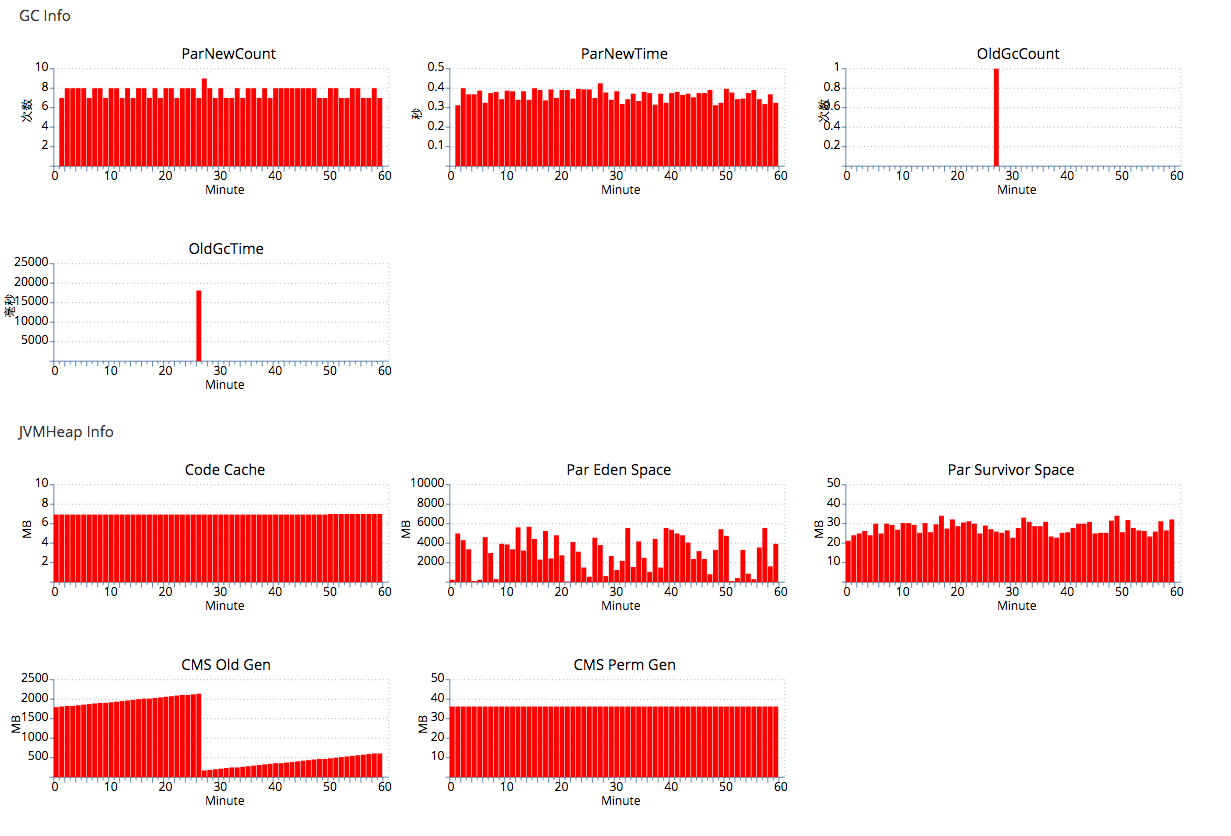
对应的jvm参数为
-Xms10g -Xmx10g -Xss512k -XX:PermSize=384m -XX:MaxPermSize=384m -XX:NewSize=7g -XX:MaxNewSize=7g
-XX:SurvivorRatio=8 -XX:MaxDirectMemorySize=4g -XX:+UseParNewGC -XX:ParallelGCThreads=4
-XX:MaxTenuringThreshold=9 -XX:+UseConcMarkSweepGC -XX:+DisableExplicitGC -XX:+UseCMSInitiatingOccupancyOnly
-XX:+ScavengeBeforeFullGC -XX:+UseCMSCompactAtFullCollection -XX:+CMSParallelRemarkEnabled
-XX:CMSFullGCsBeforeCompaction=9 -XX:CMSInitiatingOccupancyFraction=70
可以看到新生代为7G(其中Survivor为2*700M),老年代为3G,对象年龄居然只有9(导致new 区域进入到old区域的速度太快,old区域很快被撑满,频繁old gc),考虑到我这边的对象在一段时间内(几分钟)肯定会消亡,于是先进行一次调优尝试
第一次调优
将年龄调成无穷,调大young区
对应的jvm参数为
-Xms14g -Xmx14g -Xss512k -XX:PermSize=384m -XX:MaxPermSize=384m -XX:NewSize=12g -XX:MaxNewSize=12g
-XX:SurvivorRatio=18 -XX:MaxDirectMemorySize=2g -XX:+UseParNewGC -XX:ParallelGCThreads=4
-XX:MaxTenuringThreshold=30 -XX:+UseConcMarkSweepGC -XX:+DisableExplicitGC -XX:+UseCMSInitiatingOccupancyOnly
-XX:+ScavengeBeforeFullGC -XX:+UseCMSCompactAtFullCollection -XX:+CMSParallelRemarkEnabled
-XX:CMSFullGCsBeforeCompaction=9 -XX:CMSInitiatingOccupancyFraction=70 -XX:+CMSClassUnloadingEnabled
-XX:SoftRefLRUPolicyMSPerMB=0 -XX:-ReduceInitialCardMarks -XX:+CMSPermGenSweepingEnabled
-XX:CMSInitiatingPermOccupancyFraction=70
结果old区域一直为空,但是yong gc时间拉长许多,平均每次都要0.2s的时间,比之前的new gc多了整整三倍,是无法接受的:
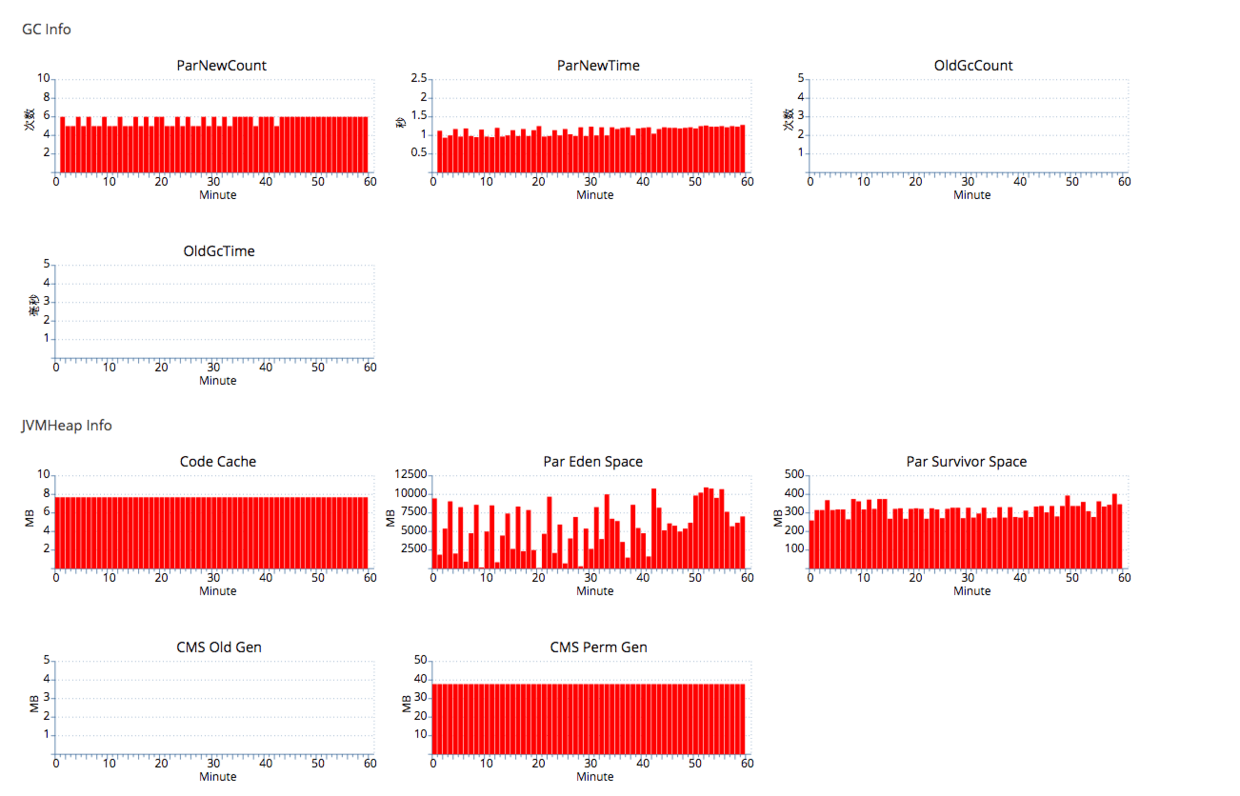
见 http://mail.openjdk.java.net/pipermail/hotspot-gc-dev/2008-May/000309.html
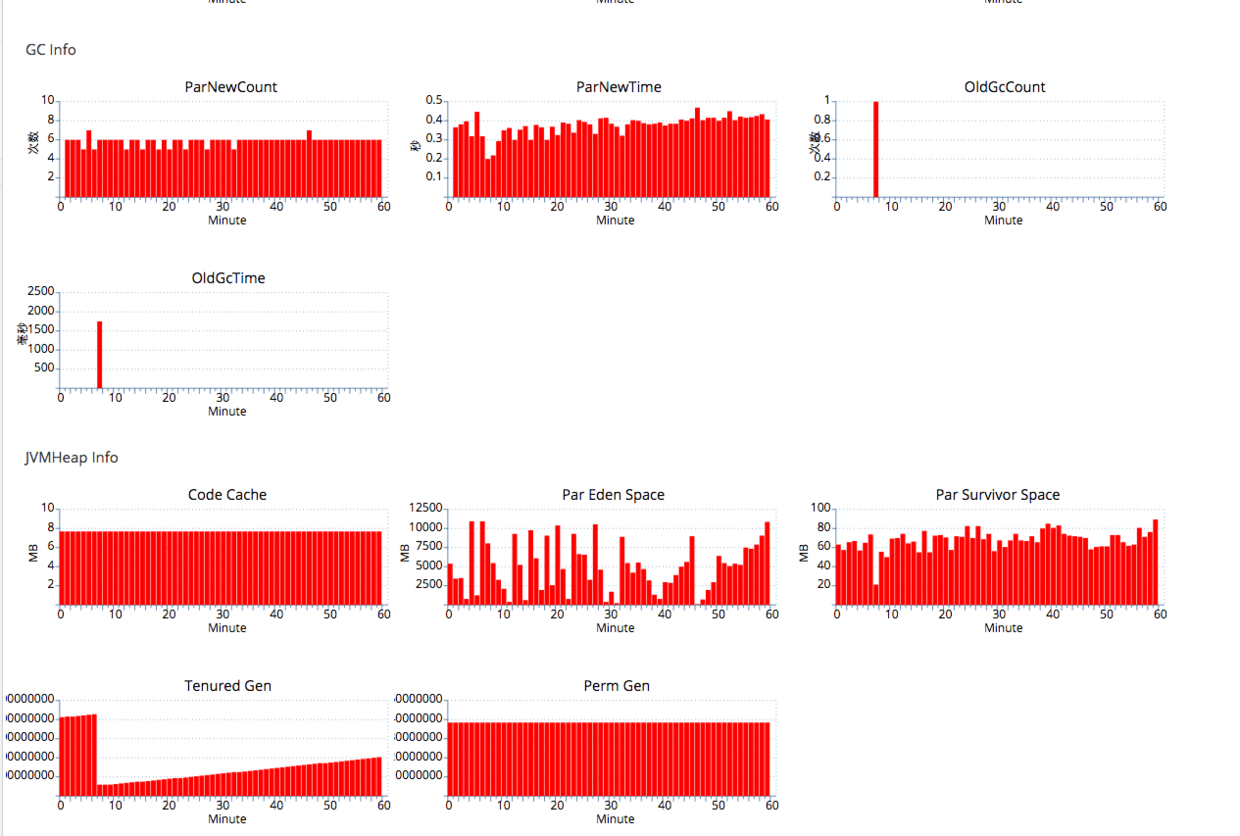
第二次调优
将XX:MaxTenuringThreshold调整回来,调整成最大的值15(大于15即对象长命百岁),由于之前cms 在old gc花的时间比较多,所以这里尝试的serial old
对应的jvm参数为
-Xms14g -Xmx14g -Xss512k -XX:PermSize=384m -XX:MaxPermSize=384m -XX:NewSize=12g -XX:MaxNewSize=12g
-XX:SurvivorRatio=18 -XX:MaxDirectMemorySize=2g -XX:+UseParNewGC -XX:ParallelGCThreads=4
-XX:MaxTenuringThreshold=15
发现效果确实比较明显,new gc的时间缩小了两倍左右,并且old gc的时间也从原来的15000ms 缩小到1500ms
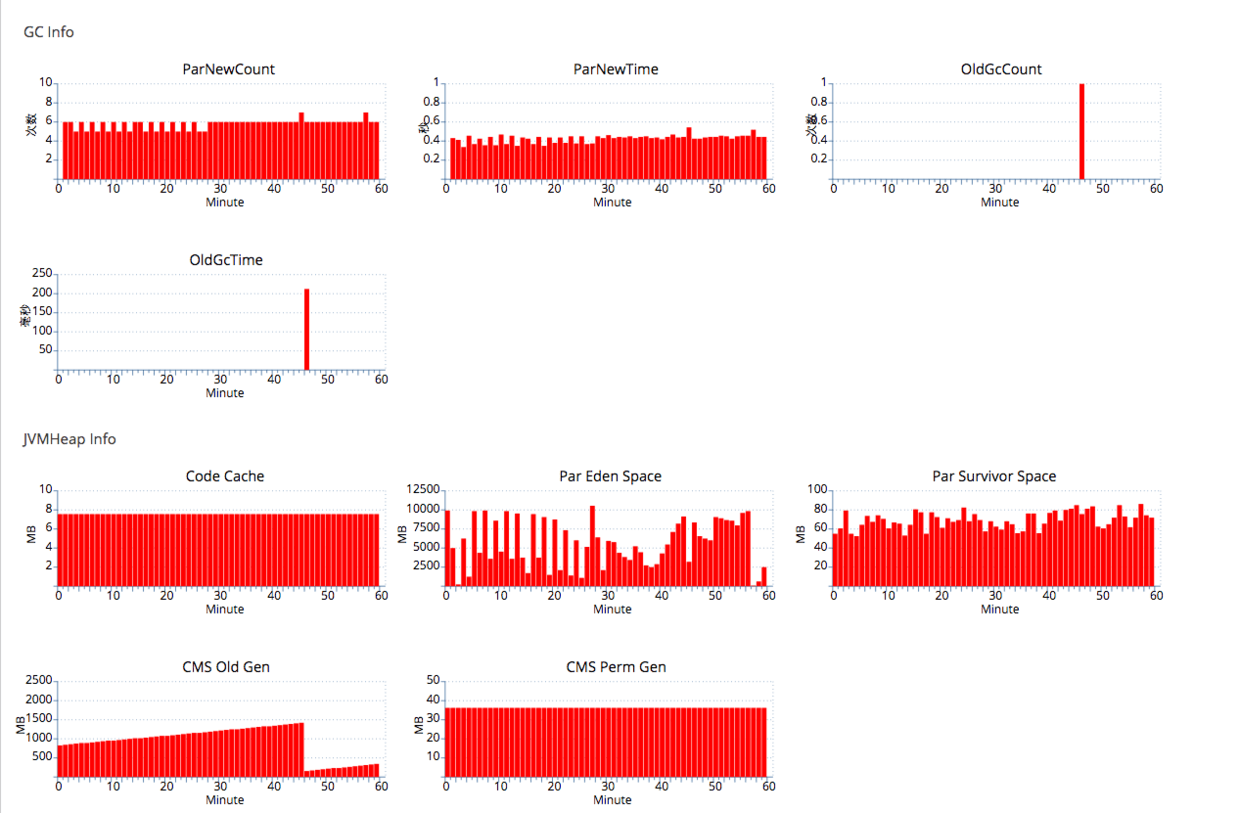
第三次调优
仔细研究了一下第二种调优方式的组合,yong区域使用parNew 的方式,old区域使用serial old 的方式,如果在其他条件都相同的条件下使用parNew+cms的方式,old gc的时间会不会大幅度缩短?毕竟cms还是比较先进的收集器,于是分析了一下cms的几个阶段,有两个阶段是stop the world的,一个是初始化标记(intial mark),一个是重复标记(cms remark),重复标记的原因是从cms old gc开始的那一刻到开始清除可能很多对象的状态都产生了变化,所以这个时候需要暂停用户所有的线程,来一次标记再清除
查看gc日志,发现remark的时间比较长,日志上下文如下
{Heap before GC invocations=23679 (full 18):
par new generation   total 6606080K, used 5902124K [0x0000000568000000, 0x0000000728000000, 0x0000000728000000)
eden space 5872128K,  99% used [0x0000000568000000, 0x00000006ce54f988, 0x00000006ce680000)
from space 733952K,   4% used [0x00000006fb340000, 0x00000006fd1bb758, 0x0000000728000000)
to   space 733952K,   0% used [0x00000006ce680000, 0x00000006ce680000, 0x00000006fb340000)
concurrent mark-sweep generation total 3145728K, used 2200878K [0x0000000728000000, 0x00000007e8000000, 0x00000007e8000000)
concurrent-mark-sweep perm gen total 393216K, used 37361K [0x00000007e8000000, 0x0000000800000000, 0x0000000800000000)
2016-08-27T17:26:00.058+0800: 261980.413: [GC2016-08-27T17:26:00.058+0800: 261980.413: [ParNew: 5902124K->27858K(6606080K), 0.0464930 secs] 8103002K->2230601K(9751808K), 0.0468010 secs] [Times: user=0.18 sys=0.00, real=0.05 secs]
Heap after GC invocations=23680 (full 18):
par new generation   total 6606080K, used 27858K [0x0000000568000000, 0x0000000728000000, 0x0000000728000000)
eden space 5872128K,   0% used [0x0000000568000000, 0x0000000568000000, 0x00000006ce680000)
from space 733952K,   3% used [0x00000006ce680000, 0x00000006d01b4910, 0x00000006fb340000)
to   space 733952K,   0% used [0x00000006fb340000, 0x00000006fb340000, 0x0000000728000000)
concurrent mark-sweep generation total 3145728K, used 2202742K [0x0000000728000000, 0x00000007e8000000, 0x00000007e8000000)
concurrent-mark-sweep perm gen total 393216K, used 37361K [0x00000007e8000000, 0x0000000800000000, 0x0000000800000000)
}
2016-08-27T17:26:00.107+0800: 261980.462: Application time: 0.0014750 seconds
2016-08-27T17:26:00.108+0800: 261980.463: [GC [1 CMS-initial-mark: 2202742K(3145728K)] 2235571K(9751808K), 0.0561400 secs] [Times: user=0.05 sys=0.00, real=0.05 secs]
2016-08-27T17:26:00.165+0800: 261980.520: [CMS-concurrent-mark-start]
2016-08-27T17:26:00.918+0800: 261981.273: [CMS-concurrent-mark: 0.753/0.754 secs] [Times: user=1.27 sys=0.12, real=0.76 secs]
2016-08-27T17:26:00.918+0800: 261981.273: [CMS-concurrent-preclean-start]
2016-08-27T17:26:00.949+0800: 261981.304: [CMS-concurrent-preclean: 0.028/0.031 secs] [Times: user=0.04 sys=0.01, real=0.03 secs]
2016-08-27T17:26:00.949+0800: 261981.304: [CMS-concurrent-abortable-preclean-start]
CMS: abort preclean due to time 2016-08-27T17:26:06.159+0800: 261986.514: [CMS-concurrent-abortable-preclean: 5.197/5.210 secs] [Times: user=8.31 sys=0.66, real=5.21 secs]
2016-08-27T17:26:06.160+0800: 261986.515: Application time: 5.9951640 seconds
2016-08-27T17:26:06.161+0800: 261986.516: [GC[YG occupancy: 4756927 K (6606080 K)]2016-08-27T17:26:06.161+0800: 261986.516: [Rescan (parallel) , 18.1621480 secs]2016-08-27T17:26:24.323+0800: 262004.678: [weak refs processing, 0.0000750 secs]2016-08-27T17:26:24.323+0800: 262004.678: [class unloading, 0.0069760 secs]2016-08-27T17:26:24.330+0800: 262004.685: [scrub symbol table, 0.0040020 secs]2016-08-27T17:26:24.334+0800: 262004.689: [scrub string table, 0.0009240 secs] [1 CMS-remark: 2202742K(3145728K)] 6959670K(9751808K), 18.1769610 secs] [Times: user=71.37 sys=0.06, real=18.18 secs]
2016-08-27T17:26:24.338+08002016-08-27T17:26:24.338+0800: : 262004.693: Application time: 0.0002080 seconds
262004.693: [CMS-concurrent-sweep-start]
2016-08-27T17:26:24.347+0800: 262004.702: Application time: 0.0079820 seconds
2016-08-27T17:26:24.868+0800: 262005.223: Application time: 0.5186580 seconds
{Heap before GC invocations=23680 (full 19):
par new generation   total 6606080K, used 5899299K [0x0000000568000000, 0x0000000728000000, 0x0000000728000000)
eden space 5872128K,  99% used [0x0000000568000000, 0x00000006ce5d44b8, 0x00000006ce680000)
from space 733952K,   3% used [0x00000006ce680000, 0x00000006d01b4910, 0x00000006fb340000)
to   space 733952K,   0% used [0x00000006fb340000, 0x00000006fb340000, 0x0000000728000000)
concurrent mark-sweep generation total 3145728K, used 1891716K [0x0000000728000000, 0x00000007e8000000, 0x00000007e8000000)
concurrent-mark-sweep perm gen total 393216K, used 37361K [0x00000007e8000000, 0x0000000800000000, 0x0000000800000000)
2016-08-27T17:26:24.870+0800: 262005.225: [GC2016-08-27T17:26:24.870+0800: 262005.225: [ParNew: 5899299K->56108K(6606080K), 0.0580910 secs] 7791015K->1949708K(9751808K), 0.0584000 secs] [Times: user=0.22 sys=0.01, real=0.05 secs]
Heap after GC invocations=23681 (full 19):
par new generation   total 6606080K, used 56108K [0x0000000568000000, 0x0000000728000000, 0x0000000728000000)
eden space 5872128K,   0% used [0x0000000568000000, 0x0000000568000000, 0x00000006ce680000)
from space 733952K,   7% used [0x00000006fb340000, 0x00000006fea0b1f8, 0x0000000728000000)
to   space 733952K,   0% used [0x00000006ce680000, 0x00000006ce680000, 0x00000006fb340000)
concurrent mark-sweep generation total 3145728K, used 1893599K [0x0000000728000000, 0x00000007e8000000, 0x00000007e8000000)
concurrent-mark-sweep perm gen total 393216K, used 37361K [0x00000007e8000000, 0x0000000800000000, 0x0000000800000000)
}
重新标记居然用了18s(这一段[1 CMS-remark: 2202742K(3145728K)] 6959670K(9751808K), 18.1769610 secs])!重新标记的时候,old区域的大小是固定的(这里设置成old区域的70%),按理说每次remark的时间应该都差不多才对,但是查了很多cms old gc日志,发现高峰期和低峰期remark的时间相差太大,两者的区别也只有elden区域,因为我这里elden的设置是比较大的,高峰期的时候,一次cms old开始,到remark之间这段时间,用户程序会和gc线程同步执行,到remark的时候,eden区很可能已经有大量对象了,如果remark之前能把eden区域的对象都清理一遍,那remark的对象将会少很多很多对吧?google了一把,发现cms有这么个参数-XX:+CMSScavengeBeforeRemark,这玩意的意思是在remark之前,来一次yong gc,满足我们的要求,加了这个参数之后
对应的jvm参数为
 -Xms14g -Xmx14g -Xss512k -XX:PermSize=384m -XX:MaxPermSize=384m -XX:NewSize=12g -XX:MaxNewSize=12g
 -XX:SurvivorRatio=18 -XX:MaxDirectMemorySize=2g -XX:+UseParNewGC -XX:ParallelGCThreads=4
 -XX:MaxTenuringThreshold=15  -XX:+CMSScavengeBeforeRemark -XX:+UseConcMarkSweepGC -XX:+DisableExplicitGC
 -XX:+UseCMSInitiatingOccupancyOnly -XX:+ScavengeBeforeFullGC -XX:+UseCMSCompactAtFullCollection
 -XX:+CMSParallelRemarkEnabled -XX:CMSFullGCsBeforeCompaction=9 -XX:CMSInitiatingOccupancyFraction=70
效果如下
{Heap before GC invocations=4644 (full 6):
 par new generation   total 11953792K, used 11384636K [0x0000000468000000, 0x0000000768000000, 0x0000000768000000)
  eden space 11324672K,  99% used [0x0000000468000000, 0x000000071b30eb48, 0x000000071b340000)
  from space 629120K,   9% used [0x000000071b340000, 0x000000071ee004e0, 0x00000007419a0000)
  to   space 629120K,   0% used [0x00000007419a0000, 0x00000007419a0000, 0x0000000768000000)
 concurrent mark-sweep generation total 2097152K, used 1464467K [0x0000000768000000, 0x00000007e8000000, 0x00000007e8000000)
 concurrent-mark-sweep perm gen total 393216K, used 37291K [0x00000007e8000000, 0x0000000800000000, 0x0000000800000000)
2016-08-28T10:46:09.846+0800: 68434.688: [GC2016-08-28T10:46:09.846+0800: 68434.688: [ParNew: 11384636K->61763K(11953792K), 0.0716150 secs] 12849103K->1528727K(14050944K), 0.0719060 secs] [Times: user=0.28 sys=0.00, real=0.07 secs]
Heap after GC invocations=4645 (full 6):
 par new generation   total 11953792K, used 61763K [0x0000000468000000, 0x0000000768000000, 0x0000000768000000)
  eden space 11324672K,   0% used [0x0000000468000000, 0x0000000468000000, 0x000000071b340000)
  from space 629120K,   9% used [0x00000007419a0000, 0x00000007455f0dd8, 0x0000000768000000)
  to   space 629120K,   0% used [0x000000071b340000, 0x000000071b340000, 0x00000007419a0000)
 concurrent mark-sweep generation total 2097152K, used 1466964K [0x0000000768000000, 0x00000007e8000000, 0x00000007e8000000)
 concurrent-mark-sweep perm gen total 393216K, used 37291K [0x00000007e8000000, 0x0000000800000000, 0x0000000800000000)
}
2016-08-28T10:46:19.590+0800: 68444.431: Application time: 9.6715460 seconds
{Heap before GC invocations=4645 (full 6):
 par new generation   total 11953792K, used 11384705K [0x0000000468000000, 0x0000000768000000, 0x0000000768000000)
  eden space 11324672K,  99% used [0x0000000468000000, 0x000000071b18f768, 0x000000071b340000)
  from space 629120K,   9% used [0x00000007419a0000, 0x00000007455f0dd8, 0x0000000768000000)
  to   space 629120K,   0% used [0x000000071b340000, 0x000000071b340000, 0x00000007419a0000)
 concurrent mark-sweep generation total 2097152K, used 1466964K [0x0000000768000000, 0x00000007e8000000, 0x00000007e8000000)
 concurrent-mark-sweep perm gen total 393216K, used 37291K [0x00000007e8000000, 0x0000000800000000, 0x0000000800000000)
2016-08-28T10:46:19.591+0800: 68444.433: [GC2016-08-28T10:46:19.591+0800: 68444.433: [ParNew: 11384705K->69180K(11953792K), 0.0728020 secs] 12851669K->1538700K(14050944K), 0.0730170 secs] [Times: user=0.27 sys=0.01, real=0.07 secs]
Heap after GC invocations=4646 (full 6):
 par new generation   total 11953792K, used 69180K [0x0000000468000000, 0x0000000768000000, 0x0000000768000000)
  eden space 11324672K,   0% used [0x0000000468000000, 0x0000000468000000, 0x000000071b340000)
  from space 629120K,  10% used [0x000000071b340000, 0x000000071f6cf378, 0x00000007419a0000)
  to   space 629120K,   0% used [0x00000007419a0000, 0x00000007419a0000, 0x0000000768000000)
 concurrent mark-sweep generation total 2097152K, used 1469519K [0x0000000768000000, 0x00000007e8000000, 0x00000007e8000000)
 concurrent-mark-sweep perm gen total 393216K, used 37291K [0x00000007e8000000, 0x0000000800000000, 0x0000000800000000)
}
2016-08-28T10:46:19.666+0800: 68444.508: Application time: 0.0019110 seconds
2016-08-28T10:46:19.667+0800: 68444.509: [GC [1 CMS-initial-mark: 1469519K(2097152K)] 1545525K(14050944K), 0.0869600 secs] [Times: user=0.09 sys=0.00, real=0.08 secs]
2016-08-28T10:46:19.755+0800: 68444.597: [CMS-concurrent-mark-start]
2016-08-28T10:46:20.418+0800: 68445.260: [CMS-concurrent-mark: 0.663/0.663 secs] [Times: user=1.47 sys=0.24, real=0.66 secs]
2016-08-28T10:46:20.418+0800: 68445.260: [CMS-concurrent-preclean-start]
2016-08-28T10:46:20.438+0800: 68445.280: [CMS-concurrent-preclean: 0.018/0.020 secs] [Times: user=0.04 sys=0.01, real=0.02 secs]
2016-08-28T10:46:20.438+0800: 68445.280: [CMS-concurrent-abortable-preclean-start]
2016-08-28T10:46:24.542+0800: 68449.384: [CMS-concurrent-abortable-preclean: 4.090/4.104 secs] [Times: user=8.60 sys=1.40, real=4.10 secs]
2016-08-28T10:46:24.543+0800: 68449.385: Application time: 4.7880220 seconds

// 这里在remark之前进行一次young gc
=====================yong gc开始=====================
2016-08-28T10:46:24.544+0800: 68449.386: [GC[YG occupancy: 5803756 K (11953792 K)]{Heap before GC invocations=4646 (full 7):
 par new generation   total 11953792K, used 5803756K [0x0000000468000000, 0x0000000768000000, 0x0000000768000000)
  eden space 11324672K,  50% used [0x0000000468000000, 0x00000005c602bd88, 0x000000071b340000)
  from space 629120K,  10% used [0x000000071b340000, 0x000000071f6cf378, 0x00000007419a0000)
  to   space 629120K,   0% used [0x00000007419a0000, 0x00000007419a0000, 0x0000000768000000)
 concurrent mark-sweep generation total 2097152K, used 1469519K [0x0000000768000000, 0x00000007e8000000, 0x00000007e8000000)
 concurrent-mark-sweep perm gen total 393216K, used 37291K [0x00000007e8000000, 0x0000000800000000, 0x0000000800000000)
2016-08-28T10:46:24.544+0800: 68449.386: [GC2016-08-28T10:46:24.544+0800: 68449.386: [ParNew: 5803756K->70533K(11953792K), 0.0668770 secs] 7273276K->1542365K(14050944K), 0.0669610 secs] [Times: user=0.25 sys=0.01, real=0.07 secs]
Heap after GC invocations=4647 (full 7):
 par new generation   total 11953792K, used 70533K [0x0000000468000000, 0x0000000768000000, 0x0000000768000000)
  eden space 11324672K,   0% used [0x0000000468000000, 0x0000000468000000, 0x000000071b340000)
 from space 629120K,  11% used [0x00000007419a0000, 0x0000000745e81738, 0x0000000768000000)
  to   space 629120K,   0% used [0x000000071b340000, 0x000000071b340000, 0x00000007419a0000)
 concurrent mark-sweep generation total 2097152K, used 1471831K [0x0000000768000000, 0x00000007e8000000, 0x00000007e8000000)
 concurrent-mark-sweep perm gen total 393216K, used 37291K [0x00000007e8000000, 0x0000000800000000, 0x0000000800000000)
}
=====================yong gc结束,开始remark=================

2016-08-28T10:46:24.611+0800: 68449.453: [Rescan (parallel) , 0.0392690 secs]2016-08-28T10:46:24.650+0800: 68449.492: [weak refs processing, 0.0001190 secs]2016-08-28T10:46:24.650+0800: 68449.492: [class unloading, 0.0072200 secs]2016-08-28T10:46:24.658+0800: 68449.500: [scrub symbol table, 0.0083430 secs]2016-08-28T10:46:24.666+0800: 68449.508: [scrub string table, 0.0011760 secs] [1 CMS-remark: 1471831K(2097152K)] 1542365K(14050944K), 0.1264420 secs] [Times: user=0.42 sys=0.01, real=0.13 secs]
2016-08-28T10:46:24.671+0800: 68449.513: [CMS-concurrent-sweep-start]
2016-08-28T10:46:24.672+0800: 68449.514: Application time: 0.0018070 seconds
2016-08-28T10:46:26.388+0800: 68451.230: [CMS-concurrent-sweep: 1.714/1.717 secs] [Times: user=3.70 sys=0.58, real=1.72 secs]
2016-08-28T10:46:26.388+0800: 68451.230: [CMS-concurrent-reset-start]
2016-08-28T10:46:26.396+0800: 68451.238: [CMS-concurrent-reset: 0.007/0.007 secs] [Times: user=0.02 sys=0.00, real=0.01 secs]
2016-08-28T10:46:34.434+0800: 68459.276: Application time: 9.7600810 seconds
可以看到,在remark之前,来一次yong gc,eden区域从50%降到0(总大小为10.8G),这些空间如果不消除,那么cms将会在这些空间上进行非常耗时的标记,最后再看看remark的时间([1 CMS-remark: 1471831K(2097152K)] 1542365K(14050944K), 0.1264420 secs]),降到0.1264420s,和原来相比,整整一百倍的提高。
总结:
最后,对于长连接,push一类的海量服务端应用,16G内存8核心,推荐的JVM参数如下
2017.06.28更新
jdk 1.7 14g->13g
-Xms13g -Xmx13g -Xss512k -XX:PermSize=384m -XX:MaxPermSize=384m -XX:NewSize=12g -XX:MaxNewSize=12g
-XX:SurvivorRatio=18 -XX:MaxDirectMemorySize=2g -XX:+UseParNewGC -XX:ParallelGCThreads=4
-XX:MaxTenuringThreshold=15 -XX:+CMSParallelRemarkEnabled -XX:+CMSScavengeBeforeRemark -XX:+UseConcMarkSweepGC
-XX:+DisableExplicitGC -XX:+UseCMSInitiatingOccupancyOnly -XX:CMSInitiatingOccupancyFraction=70
-XX:+ScavengeBeforeFullGC -XX:+UseCMSCompactAtFullCollection -XX:CMSFullGCsBeforeCompaction=9
-XX:+CMSClassUnloadingEnabled  -XX:CMSInitiatingPermOccupancyFraction=70 -XX:+ExplicitGCInvokesConcurrent
-XX:+PrintGCDetails -XX:+PrintGCDateStamps -XX:+PrintGCApplicationConcurrentTime -XX:+PrintHeapAtGC
-Xloggc:/data/applogs/heap_trace.txt -XX:-HeapDumpOnOutOfMemoryError
-XX:HeapDumpPath=/data/applogs/HeapDumpOnOutOfMemoryError
jdk1.8
-Xms13g -Xmx13g -Xss512k -XX:MetaspaceSize=384m -XX:MaxMetaspaceSize=384m -XX:NewSize=11g -XX:MaxNewSize=11g -XX:SurvivorRatio=18 -XX:MaxDirectMemorySize=2g -XX:+UseParNewGC -XX:ParallelGCThreads=4 -XX:MaxTenuringThreshold=15 -XX:+UseConcMarkSweepGC -XX:+DisableExplicitGC -XX:+UseCMSInitiatingOccupancyOnly -XX:+ScavengeBeforeFullGC -XX:+CMSScavengeBeforeRemark -XX:+CMSParallelRemarkEnabled -XX:CMSInitiatingOccupancyFraction=70 -XX:+CMSClassUnloadingEnabled -XX:SoftRefLRUPolicyMSPerMB=0 -XX:-ReduceInitialCardMarks -XX:+CMSClassUnloadingEnabled -XX:+ExplicitGCInvokesConcurrent -XX:+PrintGCDetails -XX:+PrintGCDateStamps -XX:+PrintGCApplicationConcurrentTime -XX:+PrintHeapAtGC -Xloggc:/data/applogs/heap_trace.txt -XX:-HeapDumpOnOutOfMemoryError -XX:HeapDumpPath=/data/applogs/HeapDumpOnOutOfMemoryError"
这样可以保证大多数对象在new区域就销毁,并且到了old区,remark之前先yong gc,然后再来一次cms old gc,将old gc控制在毫秒级别
如果你觉得看的不过瘾,想系统学习Netty原理,那么你一定不要错过我的Netty源码分析系列视频:https://coding.imooc.com/class/230.html
💥看到这里的你,如果对于我写的内容很感兴趣,有任何疑问,欢迎在下面留言📥,会第一次时间给大家解答,谢谢!