一次 Rancher go 应用内存占用过高问题排查原创
我们使用 Rancher、k3s 来跑边缘计算的集群,但 Rancher 的 agent 隔一段时间就内存占用过高,达到十几个 G,被 linux oom-kill 杀掉。

一个问题其实出现了挺长时间了,一直没有去分析。Rancher 其实挺复杂的,代码咱也不懂,就通过典型的问题定位手段来一步步分析和解决。
分析过程
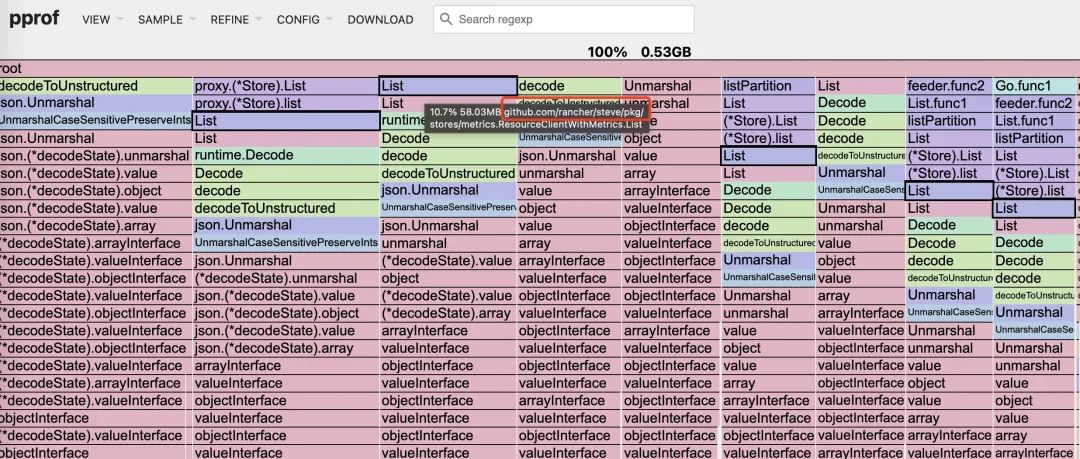
内存占用过高,本能就是先通过 dump 类的工具分析内存中到底存储的是什么。go 比较先进的是自身集成了厉害的分析工具 PProf,可以非常方便的分析 cpu、内存、goroutine、Mutex 相关的数据。
curl http://127.0.0.1:6060/debug/pprof/heap > heap.out
go tool pprof -http=:6001 heap.out
通过看火焰图,可以看到跟 rancher 子项目 steve 有关。
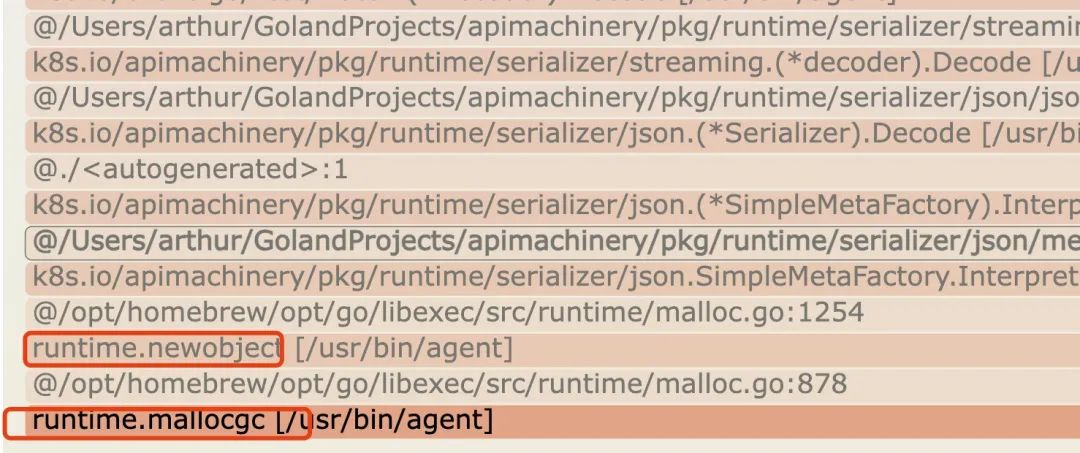
通过打日志,进一步确认内存分配的函数调用栈
runtime/debug.Stack()
        /opt/homebrew/opt/go/libexec/src/runtime/debug/stack.go:24 +0x65
runtime/debug.PrintStack()
        /opt/homebrew/opt/go/libexec/src/runtime/debug/stack.go:16 +0x19
github.com/rancher/steve/pkg/stores/metrics.ResourceClientWithMetrics.List(...)
        steve/pkg/stores/metrics/metrics_client.go:62
github.com/rancher/steve/pkg/stores/proxy.(*Store).list(0xc000ae69b0?, 0x16?, 0xc000f773b0?, {0x0?, 0x0?})
        steve/pkg/stores/proxy/proxy_store.go:248 +0x5b
github.com/rancher/steve/pkg/stores/proxy.(*Store).List(0xc0008a52c0, 0xc002a34780, 0x0?)
        steve/pkg/stores/proxy/proxy_store.go:237 +0xb1
github.com/rancher/steve/pkg/stores/proxy.(*byNameOrNamespaceStore).List(0xc0030c5bc0?, 0x406e819?, 0x5?)
        steve/pkg/stores/proxy/rbac_store.go:106 +0x77
github.com/rancher/steve/pkg/stores/partition.(*Store).listPartition(0x4a1c8a?, {0x498f878, 0xc000b3a190}, 0xc002a34690, 0x3df2dc0?, {0x4964f40?, 0x6ddda40?}, {0x0, 0x0}, {0x0, ...}, ...)
        steve/pkg/stores/partition/store.go:150 +0x253
github.com/rancher/steve/pkg/stores/partition.(*Store).List.func1({0x498f878?, 0xc000b3a190?}, {0x4964f40?, 0x6ddda40?}, {0x0?, 0x3cf9301?}, {0x0?, 0x49f1ff?}, 0x498f920?)
        steve/pkg/stores/partition/store.go:167 +0x78
github.com/rancher/steve/pkg/stores/partition.(*ParallelPartitionLister).feeder.func2()
        steve/pkg/stores/partition/parallel.go:179 +0x1fa
golang.org/x/sync/errgroup.(*Group).Go.func1()
        /opt/homebrew/Cellar/go/1.19/pkg/mod/golang.org/x/sync@v0.1.0/errgroup/errgroup.go:75 +0x64
created by golang.org/x/sync/errgroup.(*Group).Go
        /opt/homebrew/Cellar/go/1.19/pkg/mod/golang.org/x/sync@v0.1.0/errgroup/errgroup.go:72 +0xa5
通过看代码发现了可疑对象,它会把从 PartitionLister 拿回的数据缓存到 Store 的成员变量 listCache 中
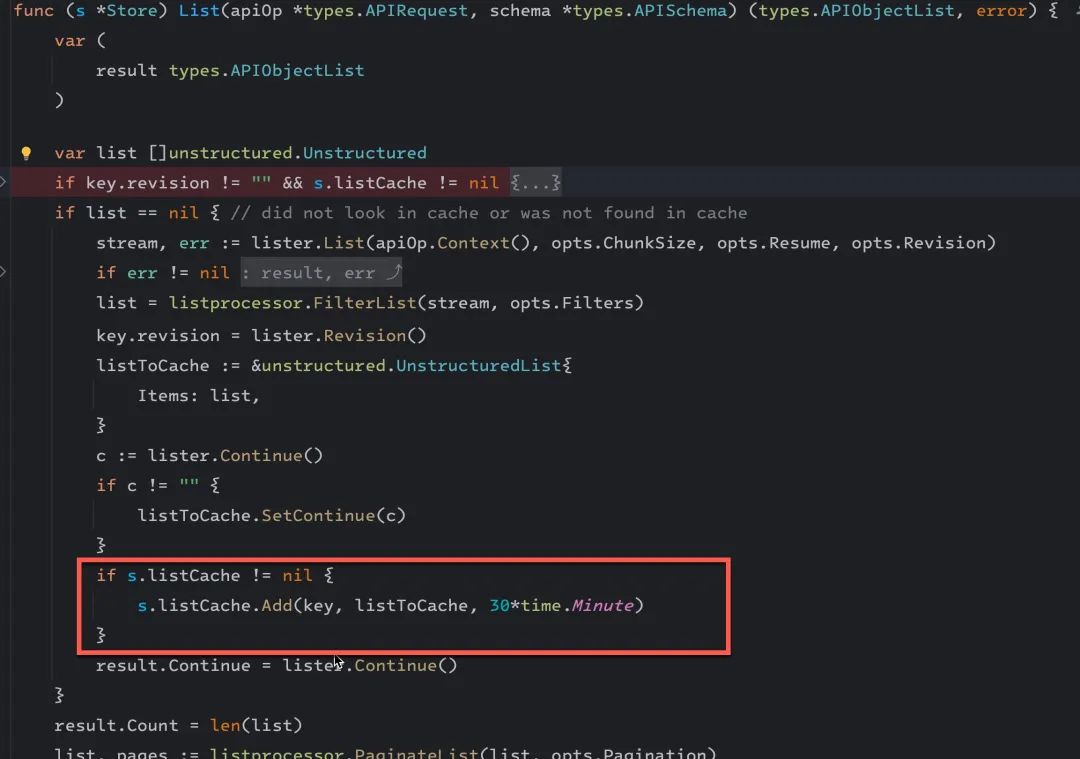
这个 listCache 是一个 LRU cache,看代码会把结果缓存 30 分钟。
type Store struct {
 Partitioner Partitioner
 listCache   *cache.LRUExpireCache
 asl         accesscontrol.AccessSetLookup
}
经过测试,这个结果集比较大,有几百 k 到几 M 的大小,默认大小为 1000 个。
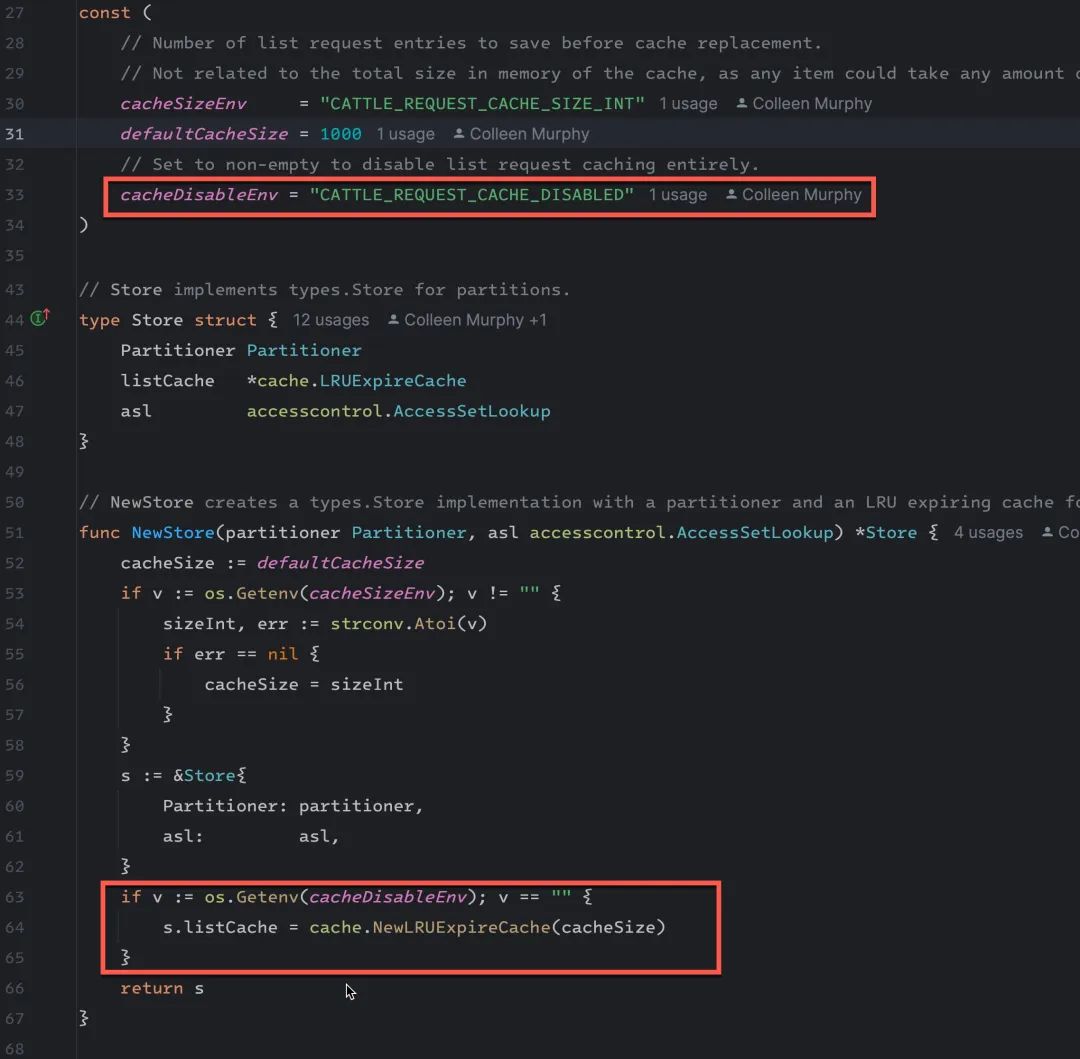
首先先通过增加一个环境变量把缓存关掉 CATTLE_REQUEST_CACHE_DISABLED=true,经过这样的处理以后,内存增长过快的问题得到了缓解。
通过 dump 改动之前的内存,可以同步印证这个做法。
# dump.sh

cat /proc/$1/maps | grep -Fv ".so" | grep " 0 " | awk '{print $1}' | grep $2 | ( IFS="-"
while read a b; do
dd if=/proc/$1/mem bs=$( getconf PAGESIZE ) iflag=skip_bytes,count_bytes \
skip=$(( 0x$a )) count=$(( 0x$b - 0x$a )) of="$1_mem_$a.bin"
done )

$ ./dump.sh pid addr

$ ls -l
39.mem_c00a800000.bin
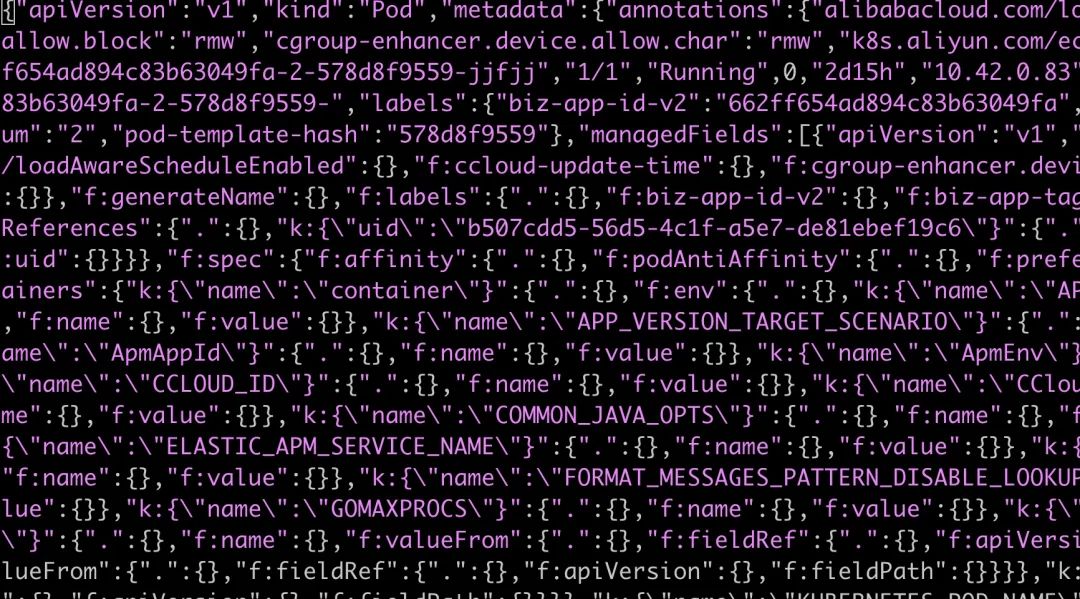
通过 strings 39.mem_c00a800000.bin 可以提取内存 dump 文件中的字符串文件,可以看到大量的 json 结果。
Goroutine 协程泄露
解决完这个问题,可以发现内存增长明显变慢,但还是有缓存的增长,通过内存分析,看到内存都集中在了 io.CopyBuffer
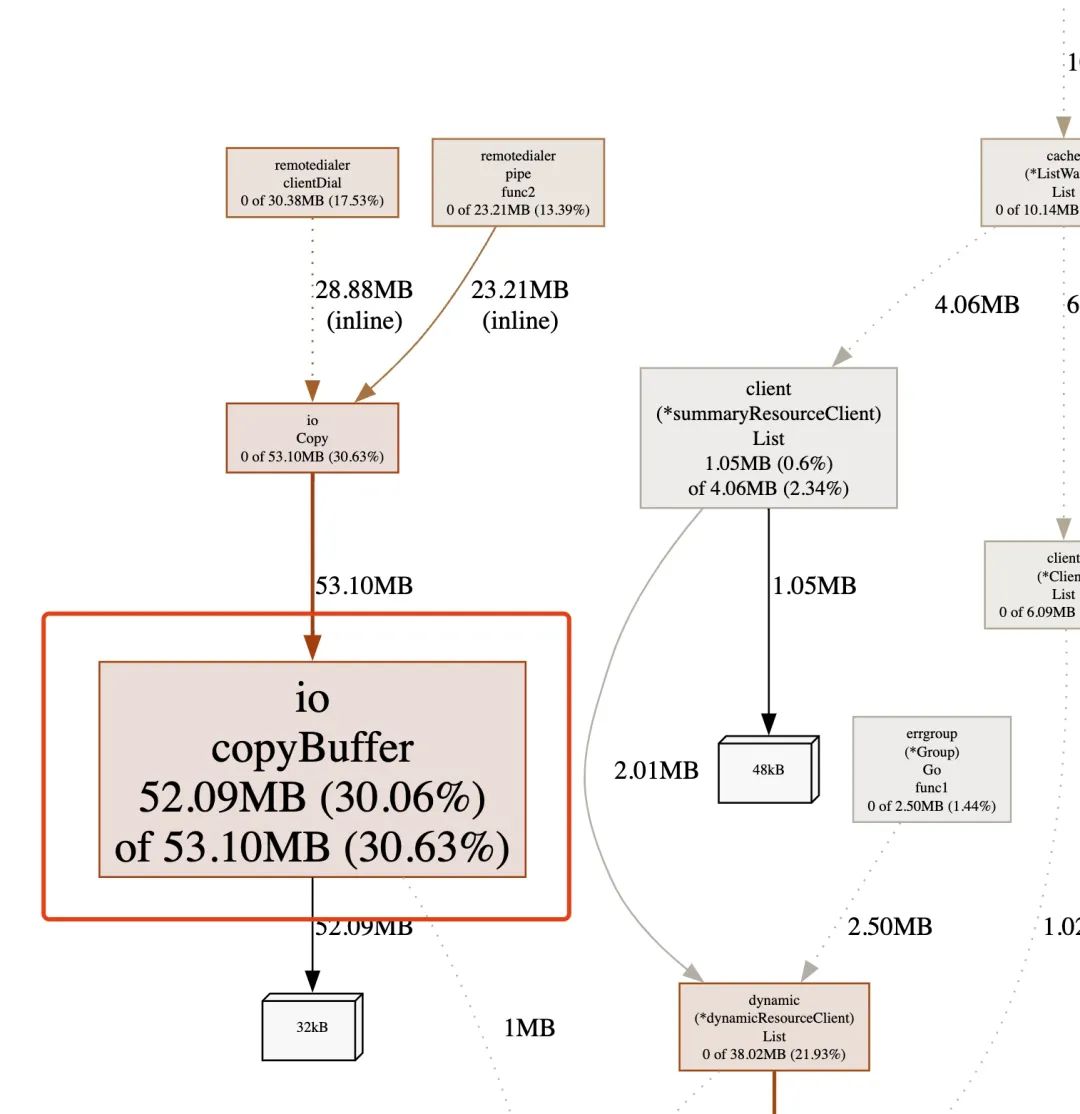
这个 io.CopyBuffer 是在一个新启动的 go 协程中执行的,看下 go 协程的分析。
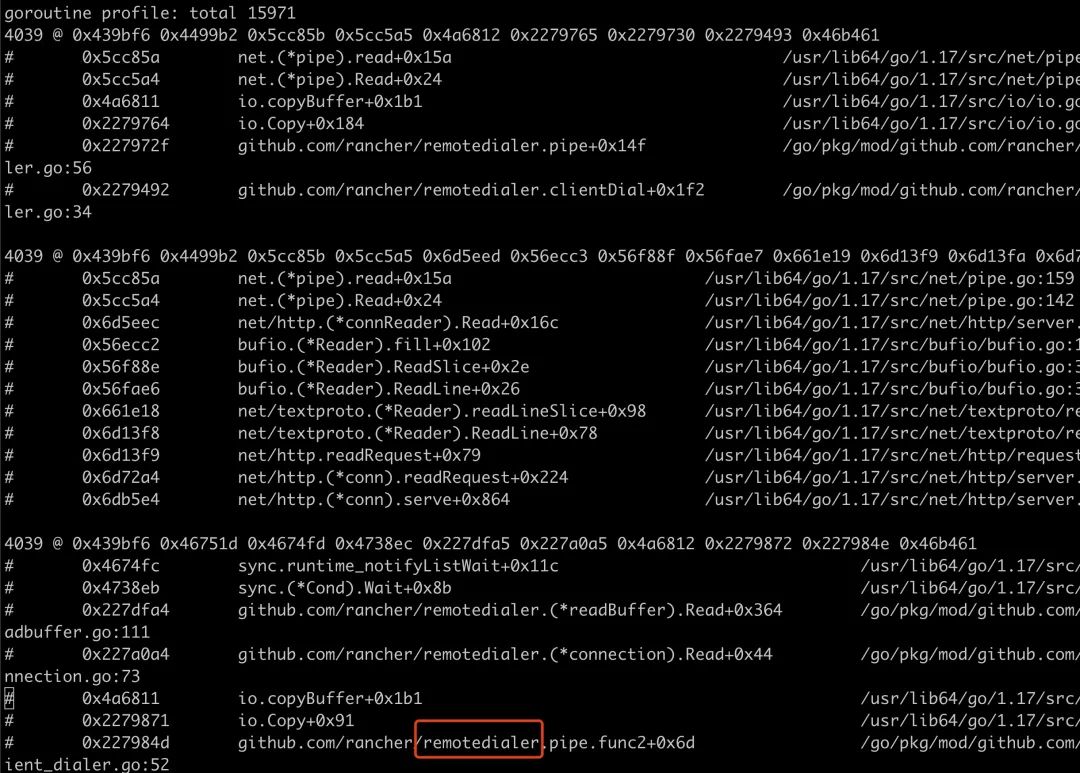
可以看到有一个明显看起来不合理的 remotedialer 模块的 go 协程数量加起来有接近 12000 个,于是去分析它的协程是如何创建的,为什么没有及时退出。
通过在创建协程的位置打印堆栈,可以看到是由 steve 模块的 aggregation.serve 在一直不停的创建协程,而且通过更详细日志的分析,这个协程是不会退出的。
/opt/homebrew/opt/go/libexec/src/runtime/debug/stack.go:24 +0x65
runtime/debug.PrintStack()
/opt/homebrew/opt/go/libexec/src/runtime/debug/stack.go:16 +0x19
github.com/rancher/remotedialer.(*Session).serveMessage
remotedialer/session.go:131 +0x56
github.com/rancher/remotedialer.(*Session).Serve
remotedialer/session.go:124 +0xea
github.com/rancher/steve/pkg/aggregation.serve
steve/pkg/aggregation/server.go:94 +0x53e
github.com/rancher/steve/pkg/aggregation.ListenAndServe
steve/pkg/aggregation/server.go:48 +0x415
created by github.com/rancher/steve/pkg/aggregation.(*handler).OnSecret
steve/pkg/aggregation/watch.go:63 +0x31d
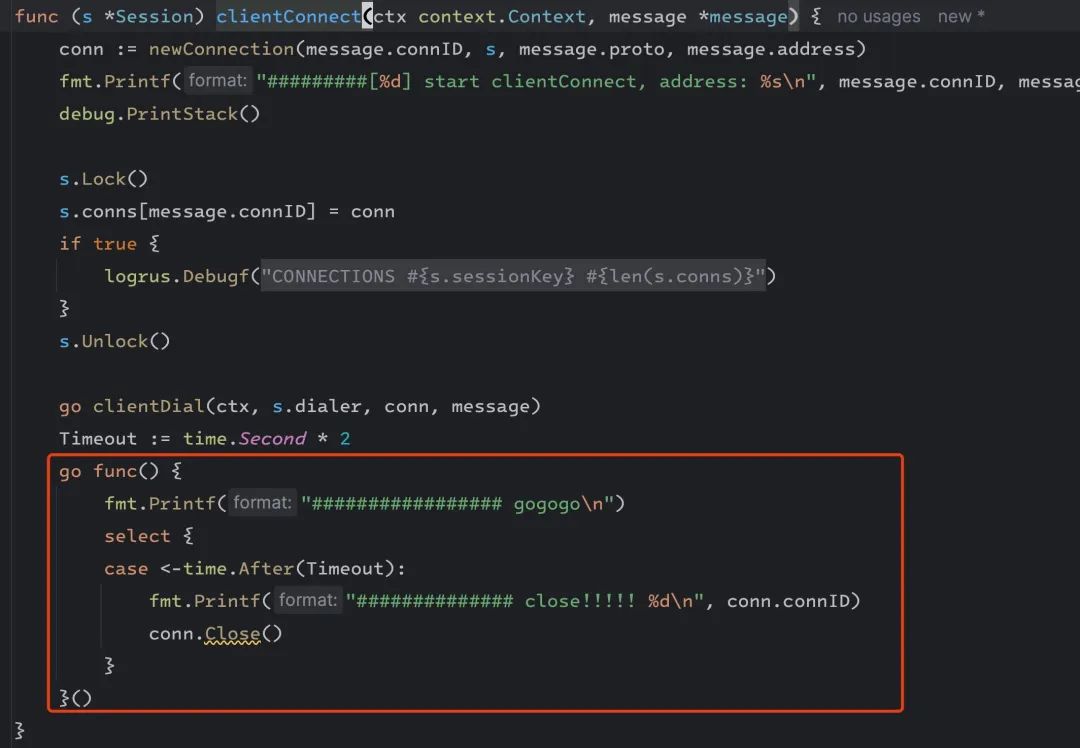
这段代码功能还有待深入研究,但这里的协程持续运行没有什么必要,这里的协程创建由 http 接口触发,但 http 短连接结束以后,这个协程并没有退出。
临时改动
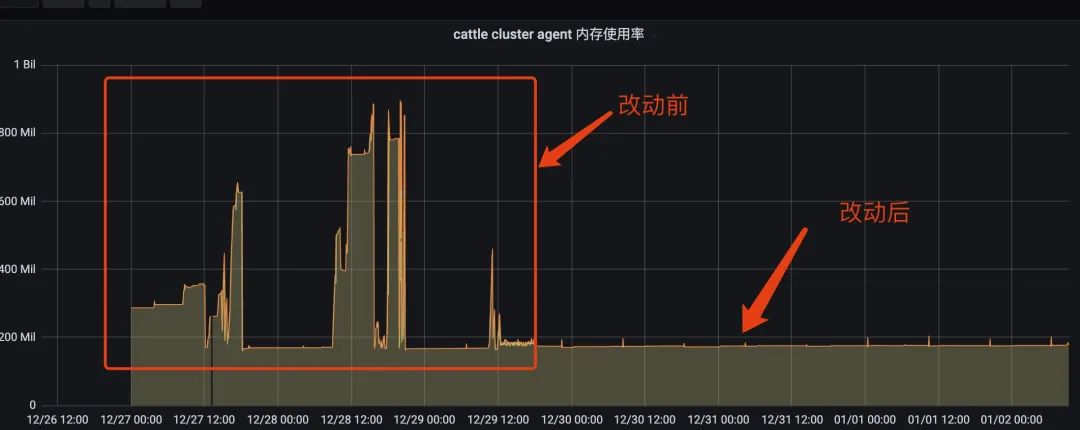
于是做了一个简单的实验性改动验证,把这个协程 2s 以后强制断开。
重新构建发布,发现协程数量稳定了下来,没有持续上涨,而且内存经过长时间运行一直稳定在了 170M 左右。
后续改动计划
接下来就是分析代码真正的作用,做出更合理的改造,还在持续分析中。
后记
分析内存泄露最重要的是能先观测、得到到底哪里是分配内存、哪里在持有内存。各大语言都有相应的分析的工具,java 有 jmap、rust 有 jemalloc 的 jeprof。
对于 Go 除了内置的 PProf,还可以基于 ebpf 去观测 go 内置的函数,比如 runtime.newObject 等获取内存分配的链路和火焰图,有机会再写一个这个相关的文章。