
译 | Linux perf_events Off-CPU Time Flame Graph转载
I’ve been asked how to do these several times, so here’s a quick blog post.
我已经被问过几次如何做到这些,所以这里有一篇简短的博客文章。
CPU Flame Graphs are great for understanding CPU usage, but what about performance issues of latency, when programs are blocked and not running on-CPU? There’s a generic methodology to attack these, which I’ve called Off-CPU Analysis. This involves instrumenting call stacks and timestamps when the scheduler blocks a thread, and when it later wakes it up. There are even Off-CPU Time Flame Graphs to visualize this blocked time, which are the counterpart to on-CPU flame graphs.
CPU火焰图对于了解CPU使用情况非常有用,但是当程序被阻塞并且不在CPU上运行时,延迟的性能问题又如何呢?有一种通用的方法可以解决这些问题,我称之为Off-CPU Analysis。这涉及到调度程序阻塞线程以及稍后唤醒线程时检测调用堆栈和时间戳。甚至还有Off-CPU时间火焰图来可视化被阻塞的时间,这是on-CPU火焰图的对应物。
Off-CPU time flame graphs may solve (say) 60% of the issues, with the remainder requiring walking the thread wakeups to find root cause. I explained off-CPU time flame graphs, this wakeup issue, and additional work, in my LISA13 talk on flame graphs (slides, youtube).
Off-CPU时间火焰图可以解决(比如说)60%的问题,其余的问题需要遍历线程唤醒以查找根本原因。我在关于火焰图的LISA13演讲(幻灯片,youtube)中解释了非cpu时间火焰图、唤醒问题和其他工作。
Here I’ll show one way to do off-CPU time flame graphs using Linux perf_events. Example (click to zoom):
在这里,我将展示一种使用Linux perf_events生成非cpu时间火焰图的方法。示例(点击放大):
Unlike the CPU flame graph, in this graph the width spans the total duration that a code path was sleeping. A “sleep 1” command was caught, shown on the far right as having slept for 1,000 ms.
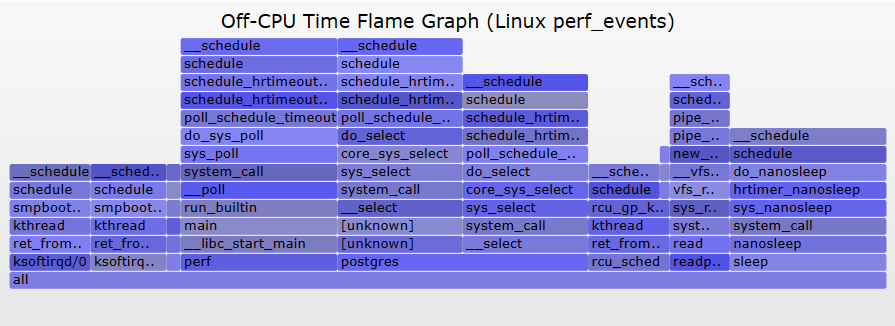
与CPU火焰图不同,在这个图中,宽度跨越了代码路径处于休眠状态的总持续时间。一个“sleep 1”命令被捕获,在最右边显示为睡了1000毫秒。
I was discussing how to do these with Nicolas on github, as he had found that perf_events could almost do this using the perf inject -s feature, when I noticed perf_events has added “-f period” to perf script (added in about 3.17). That simplifies things a bit, so the steps can be:
我正在讨论如何在github上与尼古拉斯做这些,因为他发现perf_events几乎可以使用perf注入-s特性来做到这一点,当我注意到perf_events已经添加了“-f周期”到perf脚本(添加在大约3.17)。这简化了一些事情,所以步骤可以是:
# perf record -e sched:sched_stat_sleep -e sched:sched_switch \
-e sched:sched_process_exit -a -g -o perf.data.raw sleep 1
# perf inject -v -s -i perf.data.raw -o perf.data
# perf script -f comm,pid,tid,cpu,time,period,event,ip,sym,dso,trace | awk '
NF > 4 { exec = $1; period_ms = int($5 / 1000000) }
NF > 1 && NF <= 4 && period_ms > 0 { print $2 }
NF < 2 && period_ms > 0 { printf "%s\n%d\n\n", exec, period_ms }' | \
./stackcollapse.pl | \
./flamegraph.pl --countname=ms --title="Off-CPU Time Flame Graph" --colors=io > offcpu.svg
Update: on more recent kernels, use “perf script -F …” instead of “perf script -f …”. Your kernel will also need CONFIG_SCHEDSTATS for the tracepoints to all be present, which may be missing (eg, RHEL7).
更新:在最新的内核上,使用"perf script -F…"而不是"perf script -F…"您的内核还需要CONFIG_SCHEDSTATS来显示所有跟踪点,这些跟踪点可能会丢失(例如,RHEL7)。
The awk I’m using merely turns the perf script output into something stackcollapse.pl understands. This whole perf inject workflow strikes me as a bit weird, and this step could be skipped by doing your own processing of the perf script output (more awk!), to stitch together events. I’d do this if I were on older kernels, that lacked the perf script -f period.
我使用的awk只是将性能脚本输出转换为stackcollapse.pl能够理解的内容。整个性能注入工作流让我觉得有点奇怪,可以通过自己处理性能脚本输出(更多awk!)来跳过这一步,将事件拼接在一起。如果我在旧的内核上,我就会这样做,它缺乏perf脚本-f周期。
Warning: scheduler events can be very frequent, and the overhead of dumping them to the file system (perf.data) may be prohibitive in production environments. Test carefully. This is also why I put a “sleep 1” in the perf record (the dummy command that sets the duration), to start with a **all amount of trace data. If I had to do this in production, I’d consider other tools that could summarize data in-kernel to reduce overhead, including perf_events once it supports more in-kernel programming (eBPF).
警告:调度器事件可能非常频繁,在生产环境中,将它们转储到文件系统(per .data)的开销可能令人望而却步。仔细测试。这也是为什么我在perf记录(设置持续时间的虚拟命令)中放入“sleep 1”,以便从少量跟踪数据开始。如果我必须在生产环境中这样做,我会考虑其他可以在内核中总结数据以减少开销的工具,包括perf_events,因为它支持更多的内核内编程(eBPF)。
There may be some scenarios where the current perf_events overhead is acceptable, especially if you match on a single PID of interest (in perf record, using “-p PID” instead of “-a”).
在某些情况下,当前的perf_events开销是可以接受的,特别是如果匹配单个感兴趣的PID(在perf记录中,使用“-p PID”而不是“-a”)。
Update 1: Since Linux 4.5 you may need the following for this to work:
更新1:自从Linux 4.5以来,你可能需要以下内容才能工作:
# #echo 1 > /proc/sys/kernel/sched_schedstats Echo 1 > /proc/sys/kernel/sched_schedstats . Echo 1 > /proc/sys/kernel/sched_schedstats . Echo
Update 2: Since Linux 4.6 you can use BPF to do this much more efficiently: aggregating the stacks in-kernel context (using the BPF stack trace feature in 4.6), and only passing the summary to user-level. I developed the offcputime tool bcc to do this. I also wrote a post about it, Off-CPU eBPF Flame Graph, although that was written before Linux 4.6’s stack trace support, so I was unwinding stacks the hard way.
更新2:自Linux 4.6以来,您可以使用BPF更有效地完成这项工作:聚合内核上下文中的堆栈(使用4.6中的BPF堆栈跟踪特性),并且只将摘要传递给用户级。我开发了offcputime工具bcc来做到这一点。我还写了一篇关于它的文章,Off-CPU eBPF火焰图,尽管那是在Linux 4.6的堆栈跟踪支持之前写的,所以我是用艰难的方式展开堆栈。