Lighthouse CI 是一套免费工具,有助于使用 Lighthouse 进行性能监控。单个 Lighthouse 报告提供了网页在运行时的性能快照;Lighthouse CI 显示了这些发现是如何随着时间而变化的。这可用于识别特定代码更改的影响或确保在持续集成过程中满足性能阈值。尽管性能监控是 Lighthouse CI 最常见的用例,但它也可用于监控 Lighthouse 报告的其他方面——例如 SEO 或可访问性。
Lighthouse CI 的核心功能由 Lighthouse CI 命令行界面提供。(注意:这是一个独立于Lighthouse CLI的工具。) Lighthouse CI CLI 提供了一组使用 Lighthouse CI 的命令。例如,该autorun命令执行多次 Lighthouse 运行,识别中值 Lighthouse 报告,并上传报告以供存储。通过传递额外的标志或自定义 Lighthouse CI 的配置文件,可以高度自定义此行为,lighthouserc.js.
尽管 Lighthouse CI 的核心功能主要封装在 Lighthouse CI CLI 中,但 Lighthouse CI 通常通过以下方法之一使用:
运行 Lighthouse CI 作为持续集成的一部分
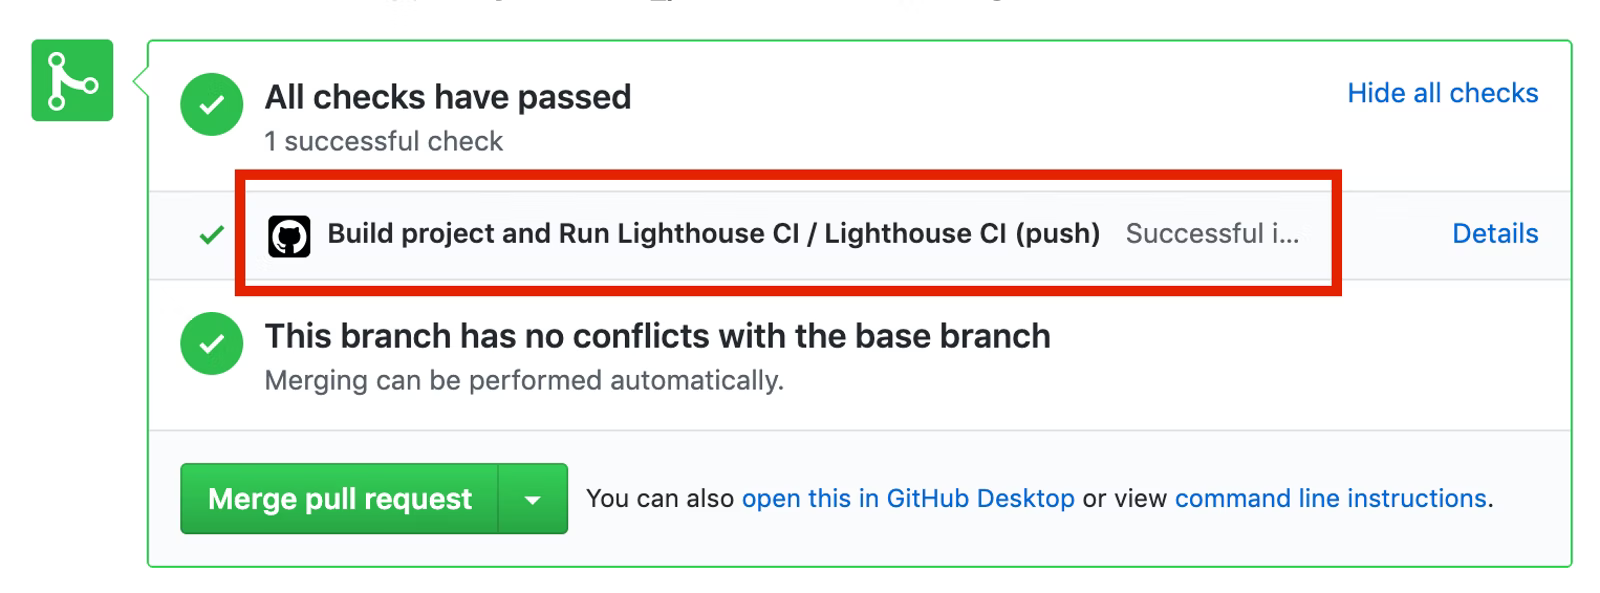
使用 Lighthouse CI GitHub Action 运行并对每个拉取请求进行评论
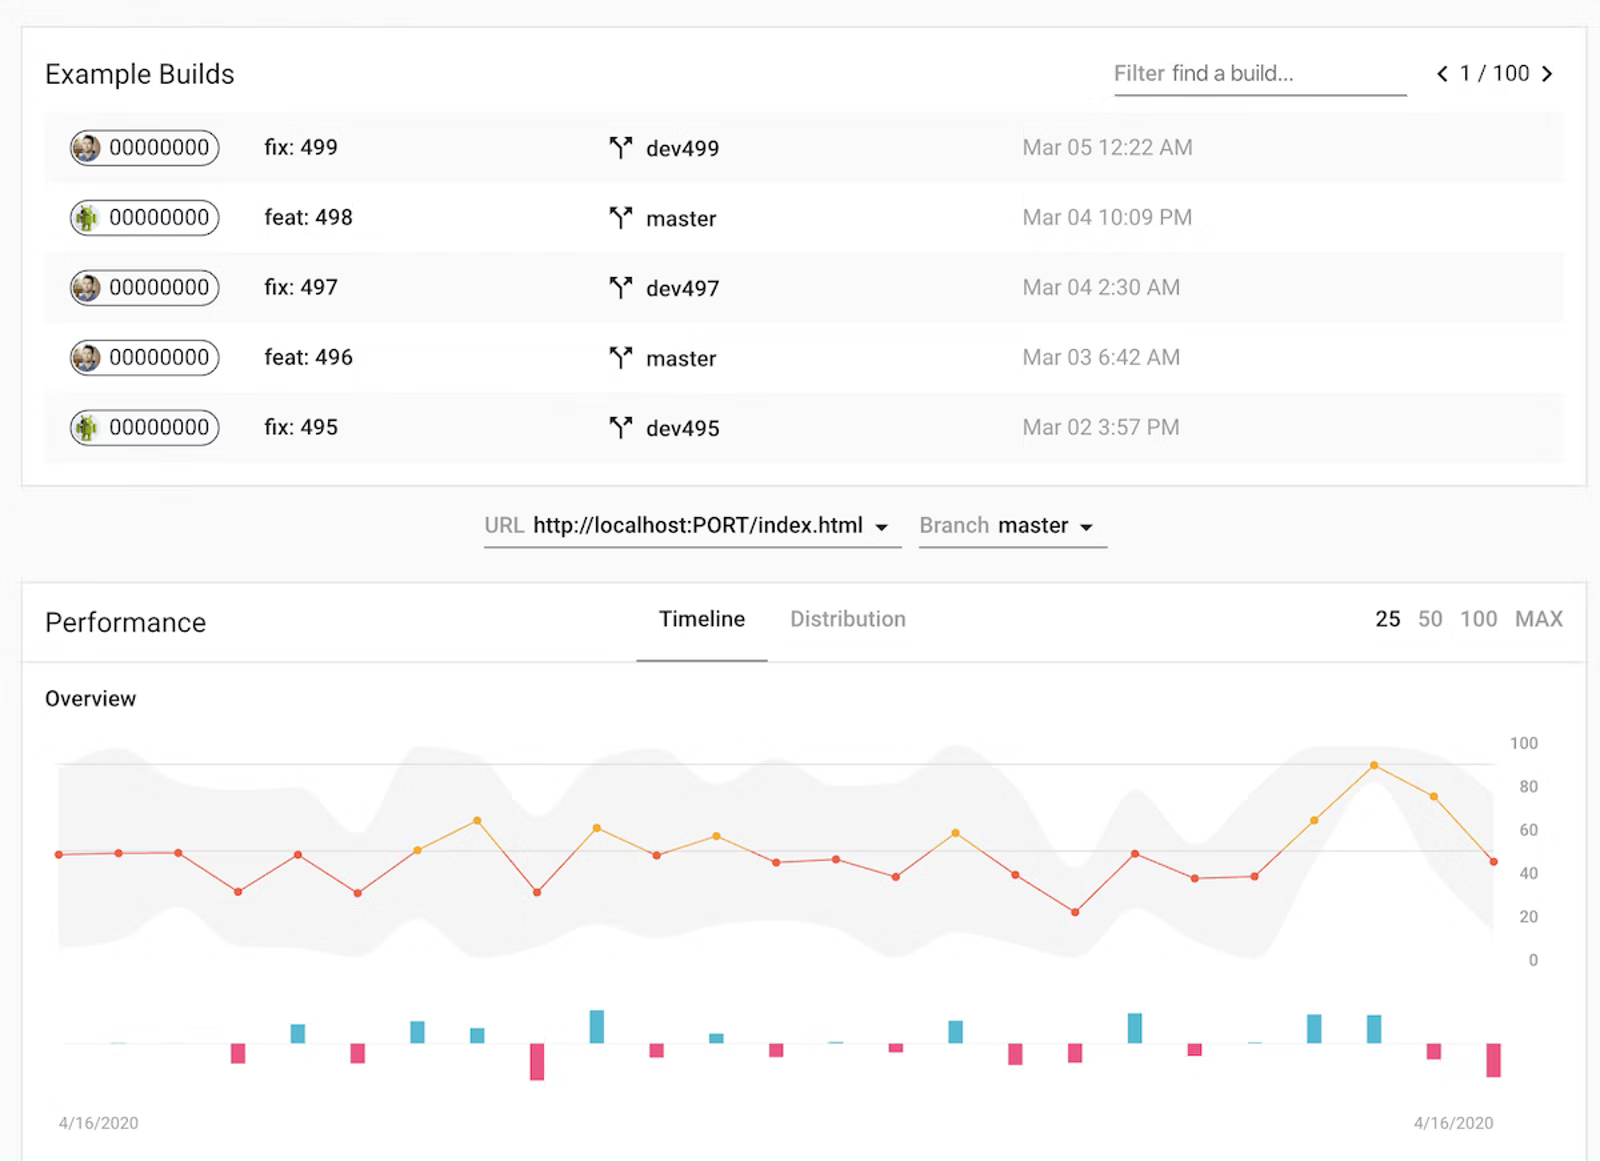
通过 Lighthouse Server 提供的仪表板随时间跟踪性能。
所有这些方法都建立在 Lighthouse CI CLI 之上。
Lighthouse CI 的替代方案包括第三方性能监控服务或编写你自己的脚本以在 CI 过程中收集性能数据。如果你希望让其他人处理你的性能监控服务器和测试设备的管理,或者如果你想要通知功能(例如电子邮件或 Slack 集成)而无需构建这些,则应该考虑使用第三方服务以自己为特色。
在本地使用 Lighthouse CI
本节介绍如何在本地运行和安装 Lighthouse CI CLI 以及如何配置lighthouserc.js. 在本地运行 Lighthouse CI CLI 是确保lighthouserc.js正确配置的最简单方法。
安装 Lighthouse CI CLI。
npm install -g @lhci/cli
Lighthouse CI 是通过将lighthouserc.js文件放在项目 repo 的根目录中来配置的。该文件是强制性的,将包含 Lighthouse CI 相关的配置信息。尽管可以将 Lighthouse CI配置为在没有 git repo的情况下使用,但本文中的说明假定你的项目 repo 已配置为使用 git。
在存储库的根目录中,创建一个lighthouserc.js配置文件。
touch lighthouserc.js
将以下代码添加到lighthouserc.js. 此代码是一个空的 Lighthouse CI 配置。您将在后面的步骤中添加到此配置。
每次 Lighthouse CI 运行时,它都会启动一个服务器来为你的站点提供服务。即使没有其他服务器正在运行,该服务器也使 Lighthouse 能够加载你的站点。当 Lighthouse CI 完成运行时,它会自动关闭服务器。为确保服务正常工作,应该配置staticDistDir或startServerCommand属性。
如果你的站点是静态的,请将该staticDistDir属性添加到ci.collect对象以指示你的静态文件所在的位置。Lighthouse CI 将在测试你的站点时使用自己的服务器来提供这些文件。如果你的站点不是静态的,请将startServerCommand属性添加到ci.collect对象以指示启动服务器的命令。Lighthouse CI 将在测试期间启动一个新的服务器进程并在之后将其关闭。
// Static site example
collect: {
  staticDistDir: './public',
}
// Dynamic site example
collect: {
  startServerCommand: 'npm run start',
}
将url属性添加到ci.collect对象以指示 Lighthouse CI 应针对其运行 Lighthouse 的 URL。该url属性的值应作为 URL 数组提供;该数组可以包含一个或多个 URL。默认情况下,Lighthouse CI 将对每个 URL 运行 Lighthouse 三次。
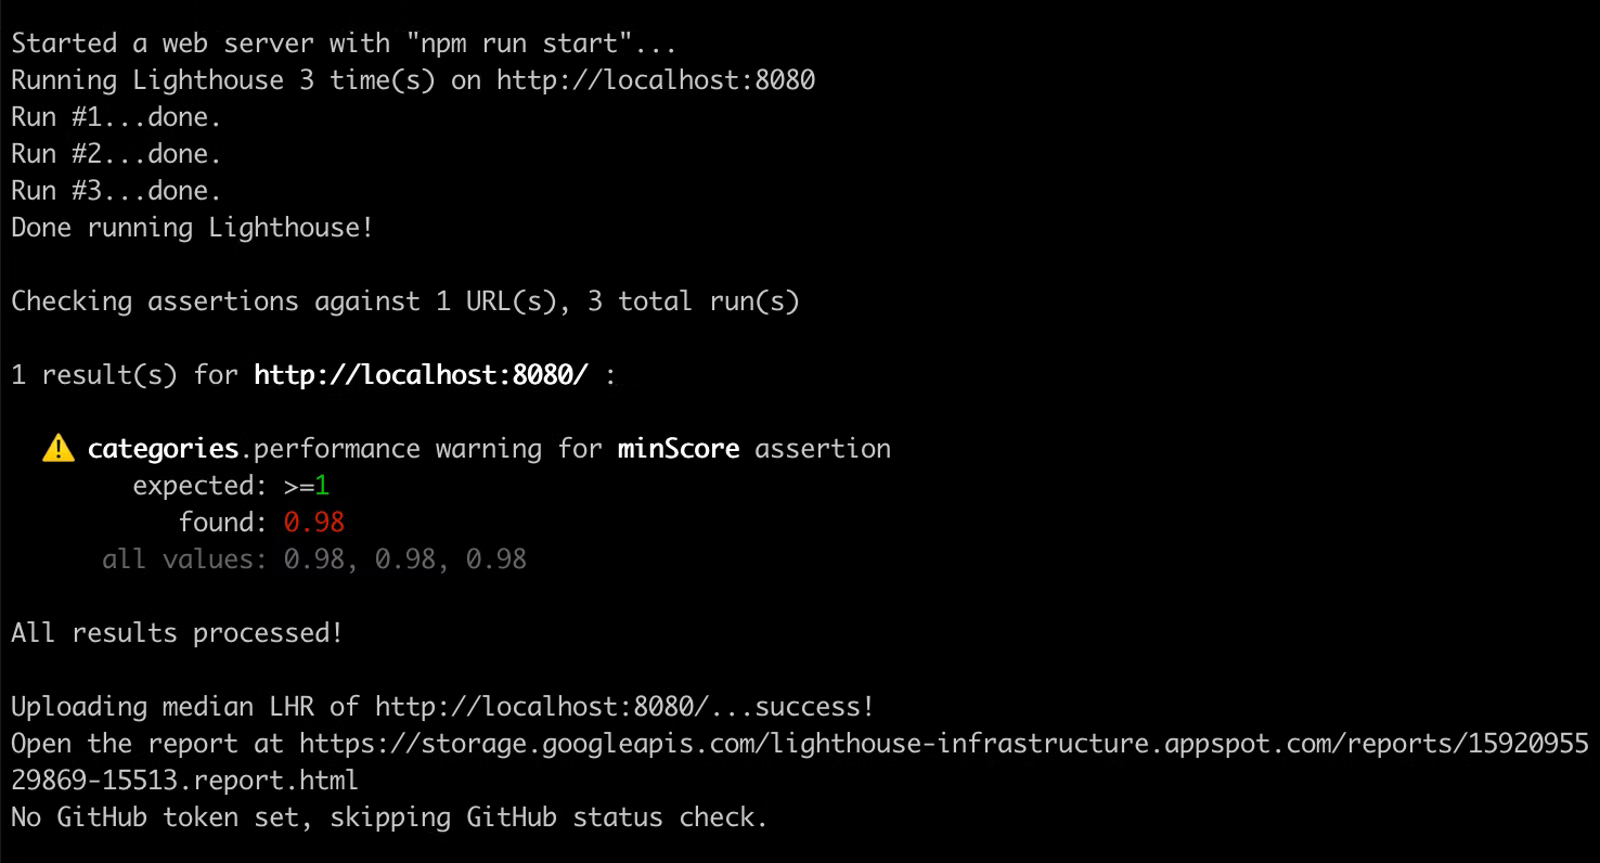
使用命令从终端运行 Lighthouse CI CLI autorun。这将运行 Lighthouse 三次并上传 Lighthouse 报告的中值。
lhci autorun
如果已经正确配置 Lighthouse CI,则运行此命令应产生类似于以下内容的输出:
✅  .lighthouseci/ directory writable
✅  Configuration file found
✅  Chrome installation found
⚠️   GitHub token not set
Healthcheck passed!

Started a web server on port 65324...
Running Lighthouse 3 time(s) on http://localhost:65324/index.html
Run #1...done.
Run #2...done.
Run #3...done.
Done running Lighthouse!

Uploading median LHR of http://localhost:65324/index.html...success!
Open the report at https://storage.googleapis.com/lighthouse-infrastructure.appspot.com/reports/1591720514021-82403.report.html
No GitHub token set, skipping GitHub status check.

Done running autorun.
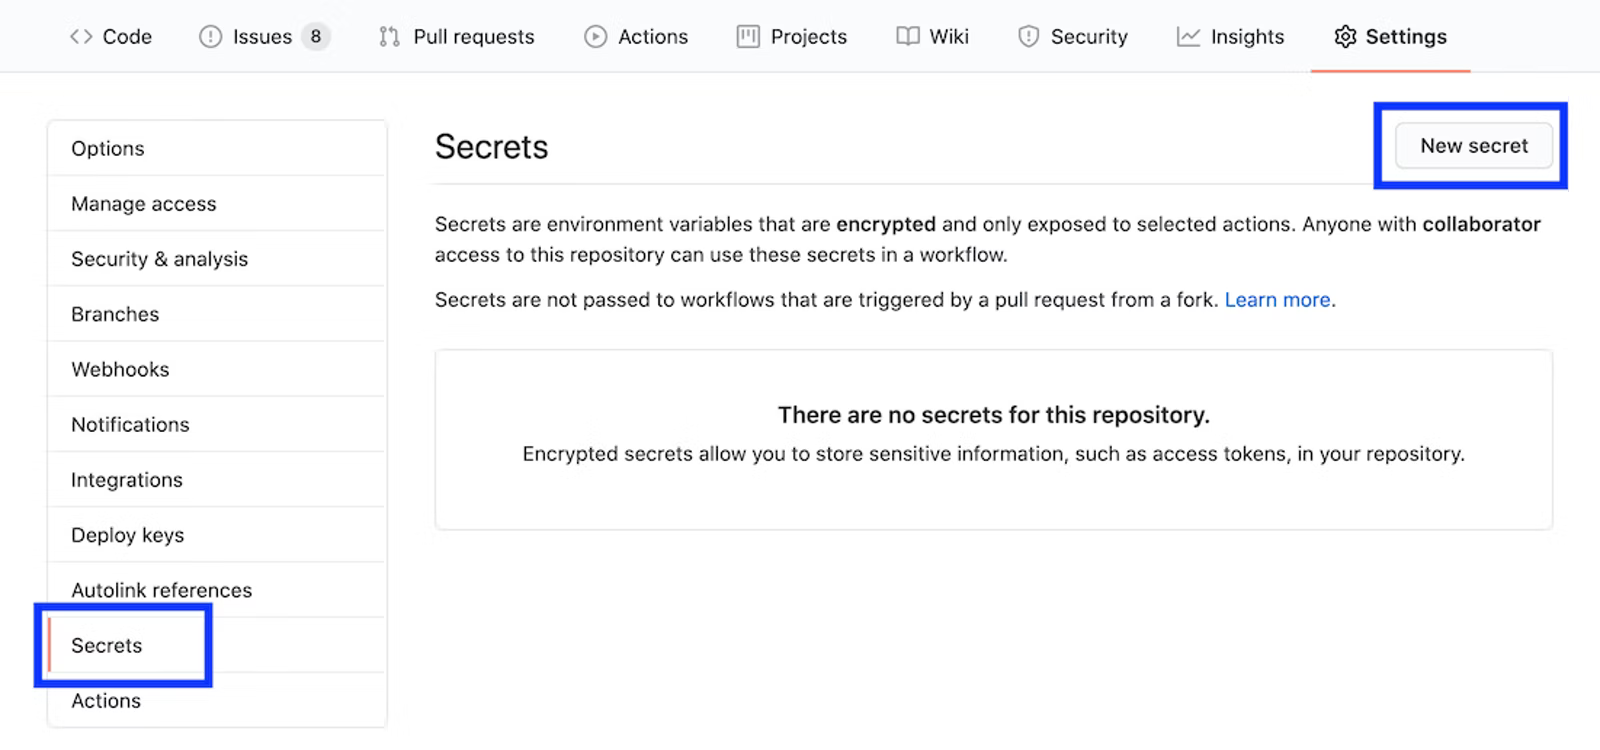
GitHub token not set控制台输出中的消息可以忽略。只有当你想将 Lighthouse CI 与 GitHub 操作一起使用时,才需要 GitHub 令牌。本文稍后将解释如何设置 GitHub 操作。
✅  .lighthouseci/ directory writable
✅  Configuration file found
✅  Chrome installation found
⚠️   GitHub token not set
Healthcheck passed!

Automatically determined ./dist as `staticDistDir`.
Set it explicitly in lighthouserc.json if incorrect.

Started a web server on port 64444...
Running Lighthouse 5 time(s) on http://localhost:64444/index.html
Run #1...done.
Run #2...done.
Run #3...done.
Run #4...done.
Run #5...done.
Done running Lighthouse!

Uploading median LHR of http://localhost:64444/index.html...success!
Open the report at https://storage.googleapis.com/lighthouse-infrastructure.appspot.com/reports/1591716944028-6048.report.html
No GitHub token set, skipping GitHub status check.

Done running autorun.
Lighthouse CI 可以与你最喜欢的 CI 工具一起使用。Lighthouse CI 文档的配置你的 CI 提供程序部分包含代码示例,展示了如何将 Lighthouse CI 合并到常用 CI 工具的配置文件中。具体来说,这些代码示例展示了如何运行 Lighthouse CI 以在 CI 过程中收集性能测量结果。
使用 Lighthouse CI 收集性能测量是开始性能监控的好地方。但是,如果高级用户不满足预定义的标准(例如通过特定的 Lighthouse 审核或满足所有性能预算),他们可能希望更进一步并使用 Lighthouse CI 来失败构建。此行为是通过文件的assert属性配置的lighthouserc.js。