
自研前端性能监控平台之 Lighthouse 定制篇原创
一、上文回顾
在自研前端性能监控平台之 Lighthouse 篇,我们介绍了 Lighthouse 的基本概念和用法,本篇接着上文,继续探索 Lighthouse 定制化之路,本文采用 Node 模块方式使用 Lighthouse。
二、Lighthouse 配置详解
Lighthouse 的基本用法如下:
const lighthouse = require('lighthouse');
...
lighthouse(url, options, config);
...
lighthouse 方法接受三个参数:url、options、config,其中 url 就是需要检测的网址,剩下两个参数分别是:
2.1 options
options 是 lighthouse 的运行时配置,它是一个对象形式,主要的参数有以下这些:
port?: number; // chrome的端口
logLevel?: 'silent' | 'error' | 'info' | 'verbose'; // 日志等级
output?: 'json' | 'html'| 'csv'; // 报告输出格式
onlyAudits?: string[] | null; // 只执行的审查器
onlyCategories?: string[] | null; // 只执行的审查类别
skipAudits?: string[] | null; // 跳过的审查器
throttlingMethod?: 'devtools' | 'simulate' | 'provided'; // 网络节流方式
throttling? ThrottlingSettings; // 网络模拟控制
emulatedFormFactor?: 'mobile' | 'desktop' | 'none'; // 模拟设备
locale?: Locale; // 语言
例如我们只想检测百度的 performance 性能,我们可以这样配置:
const lighthouse = require('lighthouse');
const chromeLauncher = require('chrome-launcher');

(async () => {
  const fs = require('fs');
  const chrome = await chromeLauncher.launch({ chromeFlags: ['--headless'] });
  const options = {
    logLevel: 'info',
    output: 'html',
    onlyCategories: ['performance'],
    port: chrome.port,
  };

  const runnerResult = await lighthouse('https://www.baidu.com', options);
  const reportHtml = runnerResult.report;
  fs.writeFileSync('lhreport.html', reportHtml);

  await chrome.kill();
})();
结果如下:
2.2 config
对于一般场景,使用 Lighthouse 本身提供的检测能力就足够了。如果我们想在 Lighthouse 基础上,实现一些特殊的检测指标,就需要使用第三个参数 config,它赋予了我们扩展检测的能力。config 也是对象形式,包括以下几个参数:
extends: 'lighthouse:default' | undefined; // 是否继承默认配置
settings: Object | undefined; // 运行时配置
passes: Object[]; // 采集器
audits: string[]; // 审查器
categories: Object | undefined; // 类别
groups: Object | undefined; // 分组
extends
该属性判断是否继承 Lighthouse 的默认配置,有两个取值 'lighthouse:default' 和 undefined,继承之后就拥有了 Lighthouse 所有内置采集器和审查器的能力,如果不继承的话只能执行自定义的采集器和审查器。
settings
该属性控制 Lighthouse 的运行时配置,具体配置与上文中的 options 参数基本一致,主要用来模拟网络/设备等参数及决定执行哪些审查器。
PS: 之前我们讲到 lighthouse 的第二个参数 options 也可以设置 onlyCategories,onlyAudits 等,那如果 options 和 config 的具体配置不一致时,lighthouse 会怎么处理呢?
比如下面的代码:
await lighthouse(
  url,
  {
    onlyCategories: ['performance'],
  },
  {
    extends: 'lighthouse:default',
    settings: {
      onlyCategories: ['seo'],
    },
  }
);
实践是检验真理的唯一标准,我们在 options 和 config 里都配置了 onlyCategories,但是两个值不一样,最后的执行结果是 performance,也就是说当 options 和 config 具体项冲突时,以 options 为准。
passes
该属性控制如何加载请求的 URL,以及在加载时采集有关页面的哪些信息,也就是我们之前说的采集器。在 settings 中的 onlyAudits 字段,如果有自定义的审查项,就需要写进去,审查器处理的是采集器传过来的内容,passes 接受一个数组,数组的每一项接受一个对象,passes 数组中的每一项都会让页面进行一次加载(例如,passes 中的 4 个条目将加载页面 4 次),因此需要谨慎在这里添加多个项目,以免延长运行时间。
注意:passes 中的每一项都要有对应的审查器(audits),否则会报错。
示例:
{
  passes: [
    {
      passName: 'fastPass',
      gatherers: ['fast-gatherer'],
    },
    {
      passName: 'slowPass',
      recordTrace: true,
      useThrottling: true,
      networkQuietThresholdMs: 5000,
      gatherers: ['slow-gatherer'],
    },
  ];
}
audits
该属性用来控制使用哪些自定义审查器来生成报告。该属性接受一个字符串数组,与 passes 相对应, 也就是自定义的审查器必须有相对应的采集器。
示例:
{
  audits: ['first-contentful-paint', 'byte-efficiency/uses-optimized-images'];
}
categories
该属性用来对审查器审查的结果进行分类,每设置一个类别项,在生成的报告里面就可以看到该类别项的信息及检测结果,并能看到该类别里有哪些审查项,及对应的检测结果。该属性是一个对象,其中的 auditRefs 属性接受一个数组,数组的每一项为对象,该对象包括了该类别中包含的审查器及其权重以及分组信息。该类别最后的测评结果也是根据每一个审查器及其权重计算出来的。
示例:
{
  categories: {
    performance: {
      title: 'Performance',
      description: 'This category judges your performance',
      auditRefs: [
        {id: 'first-meaningful-paint', weight: 2, group: 'metrics'},
        {id: 'first-contentful-paint', weight: 3, group: 'metrics'},
        {id: 'interactive', weight: 5, group: 'other'},
      ],
    }
  }
}
groups
该属性用来对一个分类下的审查项进行分组,该属性接受一个对象,包括分组名及分组描述,与 categories 中的 group 字段一一对应。
示例
{
  groups: {
    metrics: {
      title: 'Metrics',
      description: 'These metrics encapsulate your web app's performance across a number of dimensions.'
    },
  }
}
完整配置示例
{
  extends: 'lighthouse:default',
  passes: [{
    passName: 'defaultPass',
    gatherers: [
      'searchable-gatherer',
    ],
  }],
  audits: [
    'searchable-audit',
  ],
  categories: {
    mysite: {
      title: 'My site metrics',
      description: 'Metrics for our super awesome site',
      auditRefs: [
        { id: 'searchable-audit', weight: 1, group: 'metrics' },
      ],
    },
    groups: {
      'metrics': {
        title: 'Metrics',
        description: 'These metrics encapsulate your web app's performance across a number of dimensions.'
      },
    }
  },
}
三、自定义采集器和审查器
终于进入到自定义的环节,假设一个场景,我们想要拿到页面上所有加载的资源,通过分析资源的传输时间,计算资源传输的得分。在浏览器中,我们可以通过打开控制台,在 network 中查看资源的加载信息,那在 lighthouse 中该怎么做呢?
3.1 自定义采集器
首先,我们要采集某一项内容,就要先定义一个采集器。lighthouse 提供标准的采集器,我们可以在继承标准采集器的基础上写自己的采集器,在自己的采集器里,我们通常会用到两个方法,分别是 beforePass 和 afterPass,beforePass 可以设定页面加载之前的操作内容,afterPass 确定页面加载之后的采集内容,lighthouse 是通过 driver 跟浏览器通信的,driver 提供了 evaluateAsync 方法,可以在页面内执行方法,得到的结果会传给审查器。
// resource-gatherer.js
const Gatherer = require('lighthouse').Gatherer; // 引入 lighthouse 的标准采集器
class ResourceGatherer extends Gatherer {
  afterPass(options) {
    const driver = options.driver;
    return driver
      .evaluateAsync('JSON.stringify(window.performance.getEntries())') // 获取 performance 数据
      .then((loadMetrics) => {
        if (!loadMetrics) {
          throw new Error('无法获取资源');
        }
        return loadMetrics;
      });
  }
}
module.exports = ResourceGatherer;
3.2 自定义审查器
和采集器一样,lighthouse 提供标准的审查器,我们可以在继承标准审查器的基础上写自己的审查器,在自己的审查器里,我们通常会用到两个方法,一个是 meta,一个是 audit,meta 方法返回一个对象,该对象包含了该审查器的信息,特别注意的是 requiredArtifacts 字段和 id 字段,requiredArtifacts 字段的值对应着相对应的采集器,id 对应着 config 文件中对应的 audits 数组的内容。audit 方法返回一个对象,内容为这次审查的最终结果,包括 score、details 等字段。
// resource-audit.js
const Audit = require('lighthouse').Audit; // 引入 lighthouse 的标准审查器
class ResourceAudit extends Audit {
  static get meta() {
    return {
      id: 'resource-audit', // 与 audits 数组对应
      title: '资源信息',
      failureTitle: '资源加载失败',
      description: '显示所有资源',
      requiredArtifacts: ['ResourceGatherer'], // 所对应的采集器
    };
  }
  static audit(artifacts) {
    const loadMetrics = JSON.parse(artifacts.ResourceGatherer); // 获取采集内容
    if (!loadMetrics.length) {
      return {
        numericValue: 0,
        score: 1,
        displayValue: 'No list found',
      };
    }
    const score100Timing = 1000;
    const durations = loadMetrics.map((d) => d.duration);
    const duration =
      durations.reduce((prev, next) => prev + next, 0) / durations.length;
    const scores = durations.map((d) => Math.min(score100Timing / d, 1)); // 计算每项得分
    const score = scores.reduce((prev, next) => prev + next, 0) / scores.length; // 计算总分
    return {
      numericValue: duration, // 检测值
      score, // 得分
      details: {
        items: loadMetrics, // 详情
      },
      displayValue: `Query render avarage timing is ${parseInt(
        duration,
        10
      )}ms`,
    };
  }
}

module.exports = ResourceAudit;
3.3 配置自定义采集器及审查器
我们把自定义的采集器和审查器都加到配置中,完整配置如下:
// config.js
module.exports = {
  extends: 'lighthouse:default', // 继承默认配置
  settings: {
    onlyAudits: [
      'resource-audit', // 只展示我们自定义的审查器
    ],
  },
  passes: [
    {
      passName: 'defaultPass',
      gatherers: [
        'resource-gatherer', // 同目录下的 resource-gatherer.js
      ],
    },
  ],
  audits: [
    'resource-audit', // 同目录下的 resource-audit.js
  ],
  categories: {
    timing: {
      title: '资源详情',
      description: '展示页面上所有的资源加载情况',
      auditRefs: [
        { 'resource-audit', weight: 1, group: 'metrics' },
      ],
    },
  },
  groups: {
    metrics: {
      title: '资源',
      description: '加载时间过长的资源',
    },
};
3.4 在 Lighthouse 中使用
最后把所有配置传给 lighthouse 方法,完整代码如下:
const fs = require('fs');
const lighthouse = require('lighthouse');
const chromeLauncher = require('chrome-launcher');
const config = require(`./config`);

(async () => {
  const chrome = await chromeLauncher.launch({ chromeFlags: ['--headless'] });
  const options = {
    logLevel: 'info',
    output: 'html',
    port: chrome.port,
    formFactor: 'desktop',
  };
  const runnerResult = await lighthouse(
    'https://www.baidu.com/',
    options,
    config // 自定义配置
  );

  const reportHtml = runnerResult.report;
  fs.writeFileSync('lhreport.html', reportHtml);

  await chrome.kill();
})();
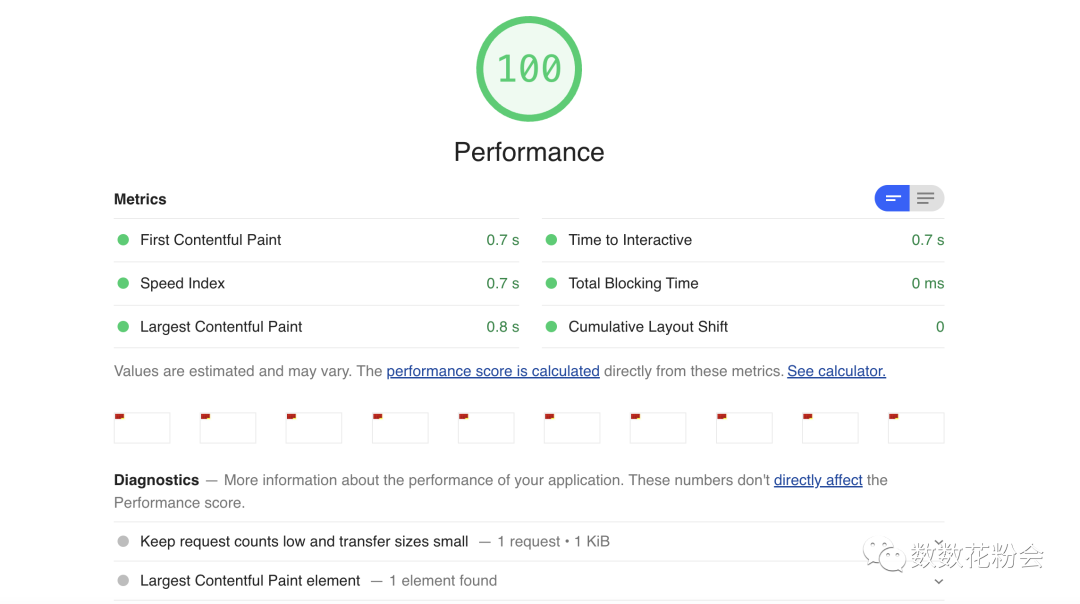
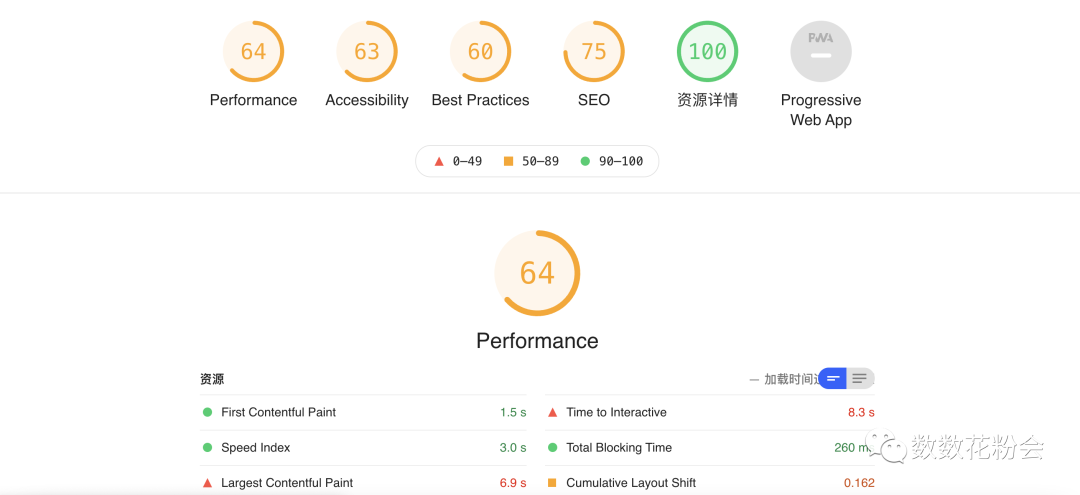
3.5 结果展示
只展示我们自定义的审查器

展示默认和自定义的审查器
四、结尾
本文主要介绍了如何使用 Lighthouse 的自定义采集器和审查器检测网页特殊指标,大家可以在此基础上发挥自己的想法来实现各种检测能力,不过仅仅使用 Lighthouse 只能直接检测一个具体网址,如果涉及到登录、点击、跳转等交互操作就有些乏力,这种情况下我们就需要借助无头浏览器的能力了,下一篇我们将介绍 Puppeteer 的基本用法。
参考链接:
-
https://github.com/GoogleChrome/lighthouse/blob/master/docs/readme.md -
https://github.com/GoogleChrome/lighthouse/tree/master/docs/recipes/custom-audit
我们是数数科技前端团队,目前负责游戏行业使用最多的用户行为分析系统的研发,同时也在积极探索前端新技术和新领域,如果你对游戏、大数据、可视化、工程化、全栈等方面有兴趣,欢迎加入我们,共创未来!


邮箱:young@thinkingdata.cn