借助Xpocket中的perf插件 了解cpu热点函数的抓取原理原创
本文使用了xpocket工具包的插件链接
xpocket地址: https://plugin.xpocket.perfma.com
perf插件地址: https://plug in.xpocket.perfma.com/plugin/57
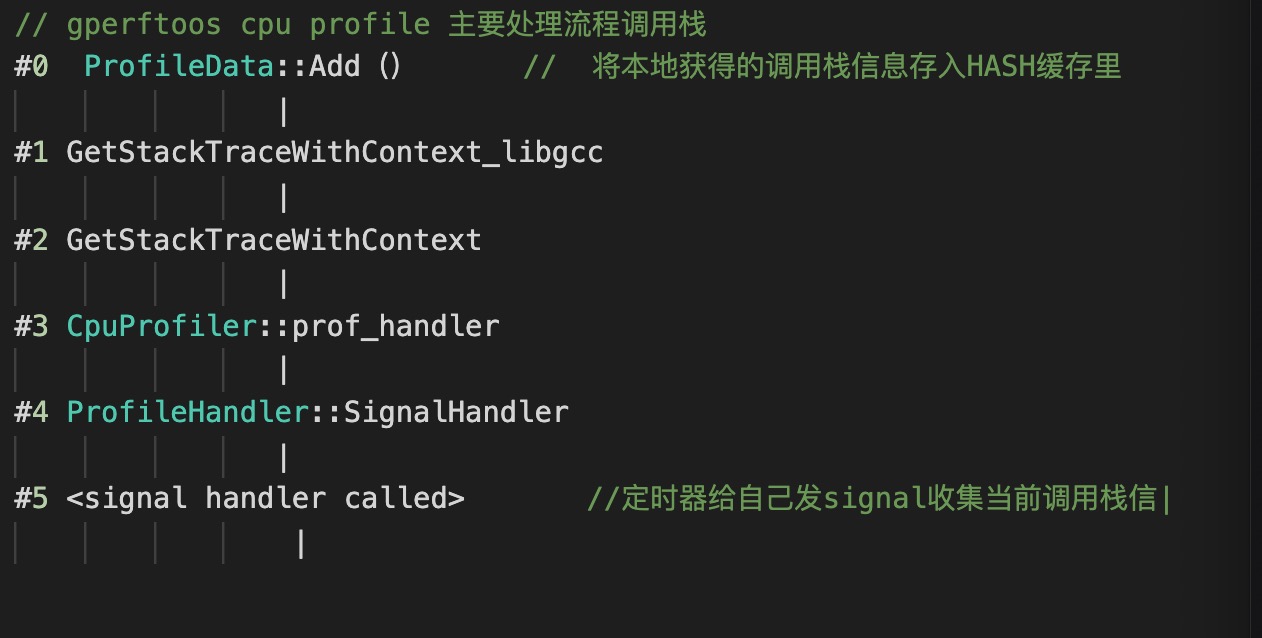
cpu热点抓取原理,怎么才能知道是进程的哪一个函数消耗了cpu资源呢?目前gperftools,async-profile,perf 都针对不同的语言提供了抓取cpu热点函数的功能,他们抓取的原理都很类似,如果不依赖内核支持的话,简单来说就是在用户空间设置一个timer定时器,timer以一定的频率向进程发送信号,在信号处理函数中可以拿到进程正在执行的调用栈,将采集到这些调用栈统计分析一下,数量最多的那个及时占用cpu最高的热点函数
gperftools的实现代码在profiler.cc,profile-handler.cc, 中定时器回调函数处理流程调用栈如下图所示。
async-proflie的itimer引擎使用了跟gperftools一样的原理,代码更加简单和清晰
#include <sys/time.h>
#include "itimer.h"
#include "os.h"
#include "profiler.h"
long ITimer::_interval;
// SIGPROF信号处理函数,在函数中获取进程的当前调用栈并存储
void ITimer::signalHandler(int signo, siginfo_t* siginfo, void* ucontext) {
Profiler::_instance.recordSample(ucontext, _interval, 0, NULL);
}
Error ITimer::start(Arguments& args) {
if (args._interval < 0) {
return Error("interval must be positive");
}
_interval = args._interval ? args._interval : DEFAULT_INTERVAL;
OS::installSignalHandler(SIGPROF, signalHandler);
long sec = _interval / 1000000000;
long usec = (_interval % 1000000000) / 1000;
struct itimerval tv = {{sec, usec}, {sec, usec}};
setitimer(ITIMER_PROF, &tv, NULL);
//设置timer timer 到期后向当前进程发送SIGPROF信号
return Error::OK;
}
void ITimer::stop() {
struct itimerval tv = {{0, 0}, {0, 0}};
setitimer(ITIMER_PROF, &tv, NULL);
}
原理比较清楚了,但是async-profile默认的引擎和perf工具则是依赖perf_event来抓取热点的并没有使用timer.
perf是一个功能强大的性能统计和分析工具 https://perf.wiki.kernel.org/index.php/Tutorial
perf_event是perf相关的一个系统调用,由内核提供给进程使用功能强大,其中的抓取cpu热点分支相对于上述timer方式存在下面几个优点
- 由硬件和内核触发,更加精确 在最初版本中可以看到当前运行函数的调用栈由intel_pmu_handle_irq()触发,This handler is triggered by the local APIC
- 因为代码在内核中,抓取热点函数调用栈非常的高效,对应用程序性能几乎没有影响
- 不同于gperftools和async-profile需要再目标程序中加载额外代码, perf_event对于目标程序没有任何入侵性。
- perf_event可抓取的信息非常丰富,cpu热点只是其中之一
下面我们使用一个例子,首先构造一个消耗cpu的函数, 该例子为了测试调用栈的抓取情况,调用层次比较复杂一些
#include <pthread.h>
const int num = 2;
int fun2()
{
while(1) {}
}
int fun1()
{
fun2();
}
int fun4()
{
while(1) {}
}
int fun3()
{
fun4();
}
int fun5()
{
while(1) {}
}
void *func(void* arg) {
fun1();
return ((void *)0);
}
void *func3(void* arg) {
fun3();
return ((void *)0);
}
int main(int argc, char* argv[]) {
int i,j;
pthread_t threads[num];
//for ( i = 0; i < num; i++) {
pthread_create(&threads[i], NULL, func, NULL);
pthread_create(&threads[i], NULL, func3, NULL);
//}
fun5();
for (i = 0; i < num; i++) {
pthread_join(threads[i], NULL);
}
return 0;
}
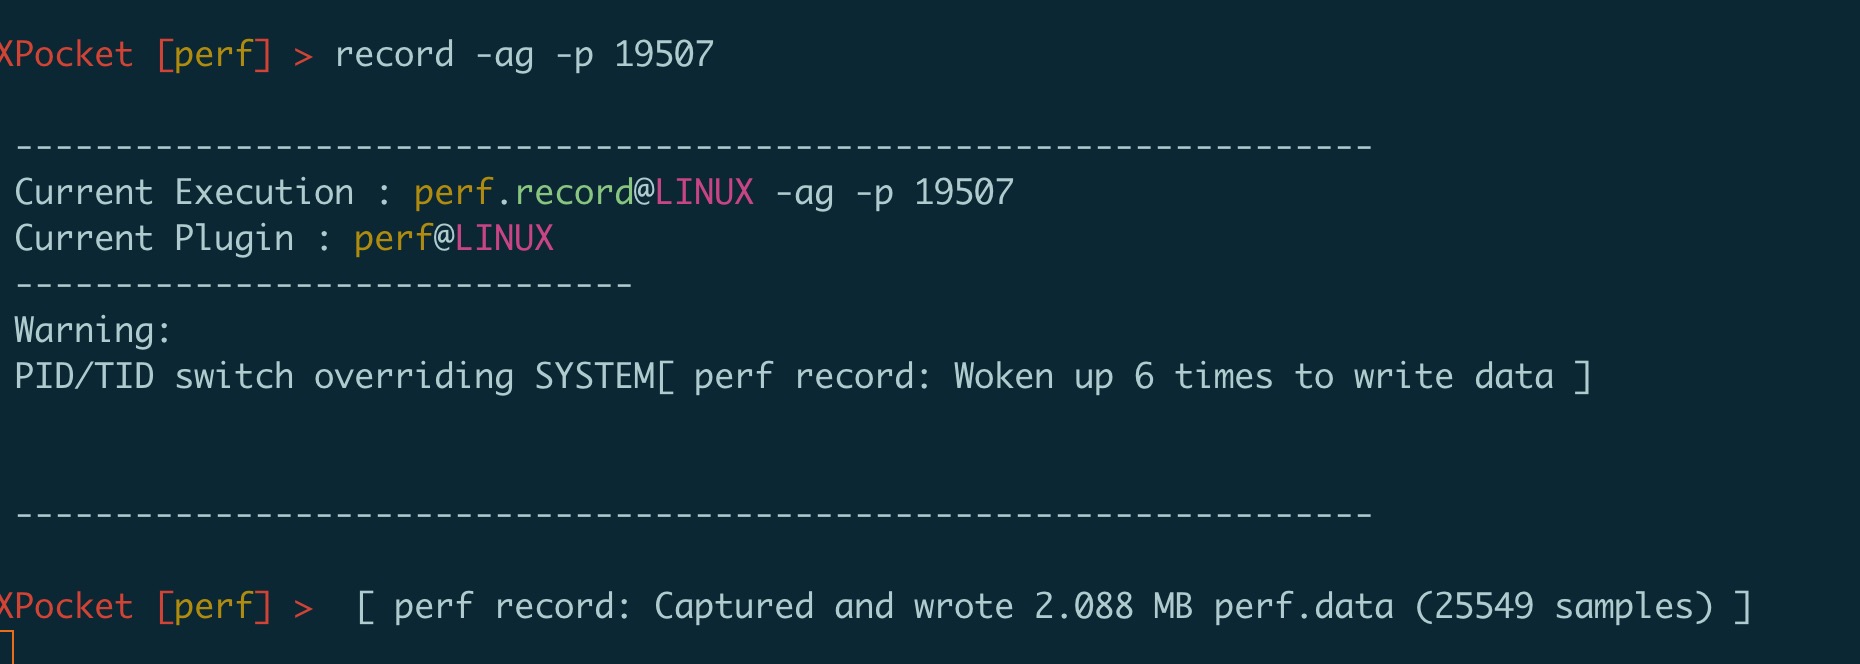
编译运行改程序,使用xpocket工具中的perf插件抓取cpu热点:
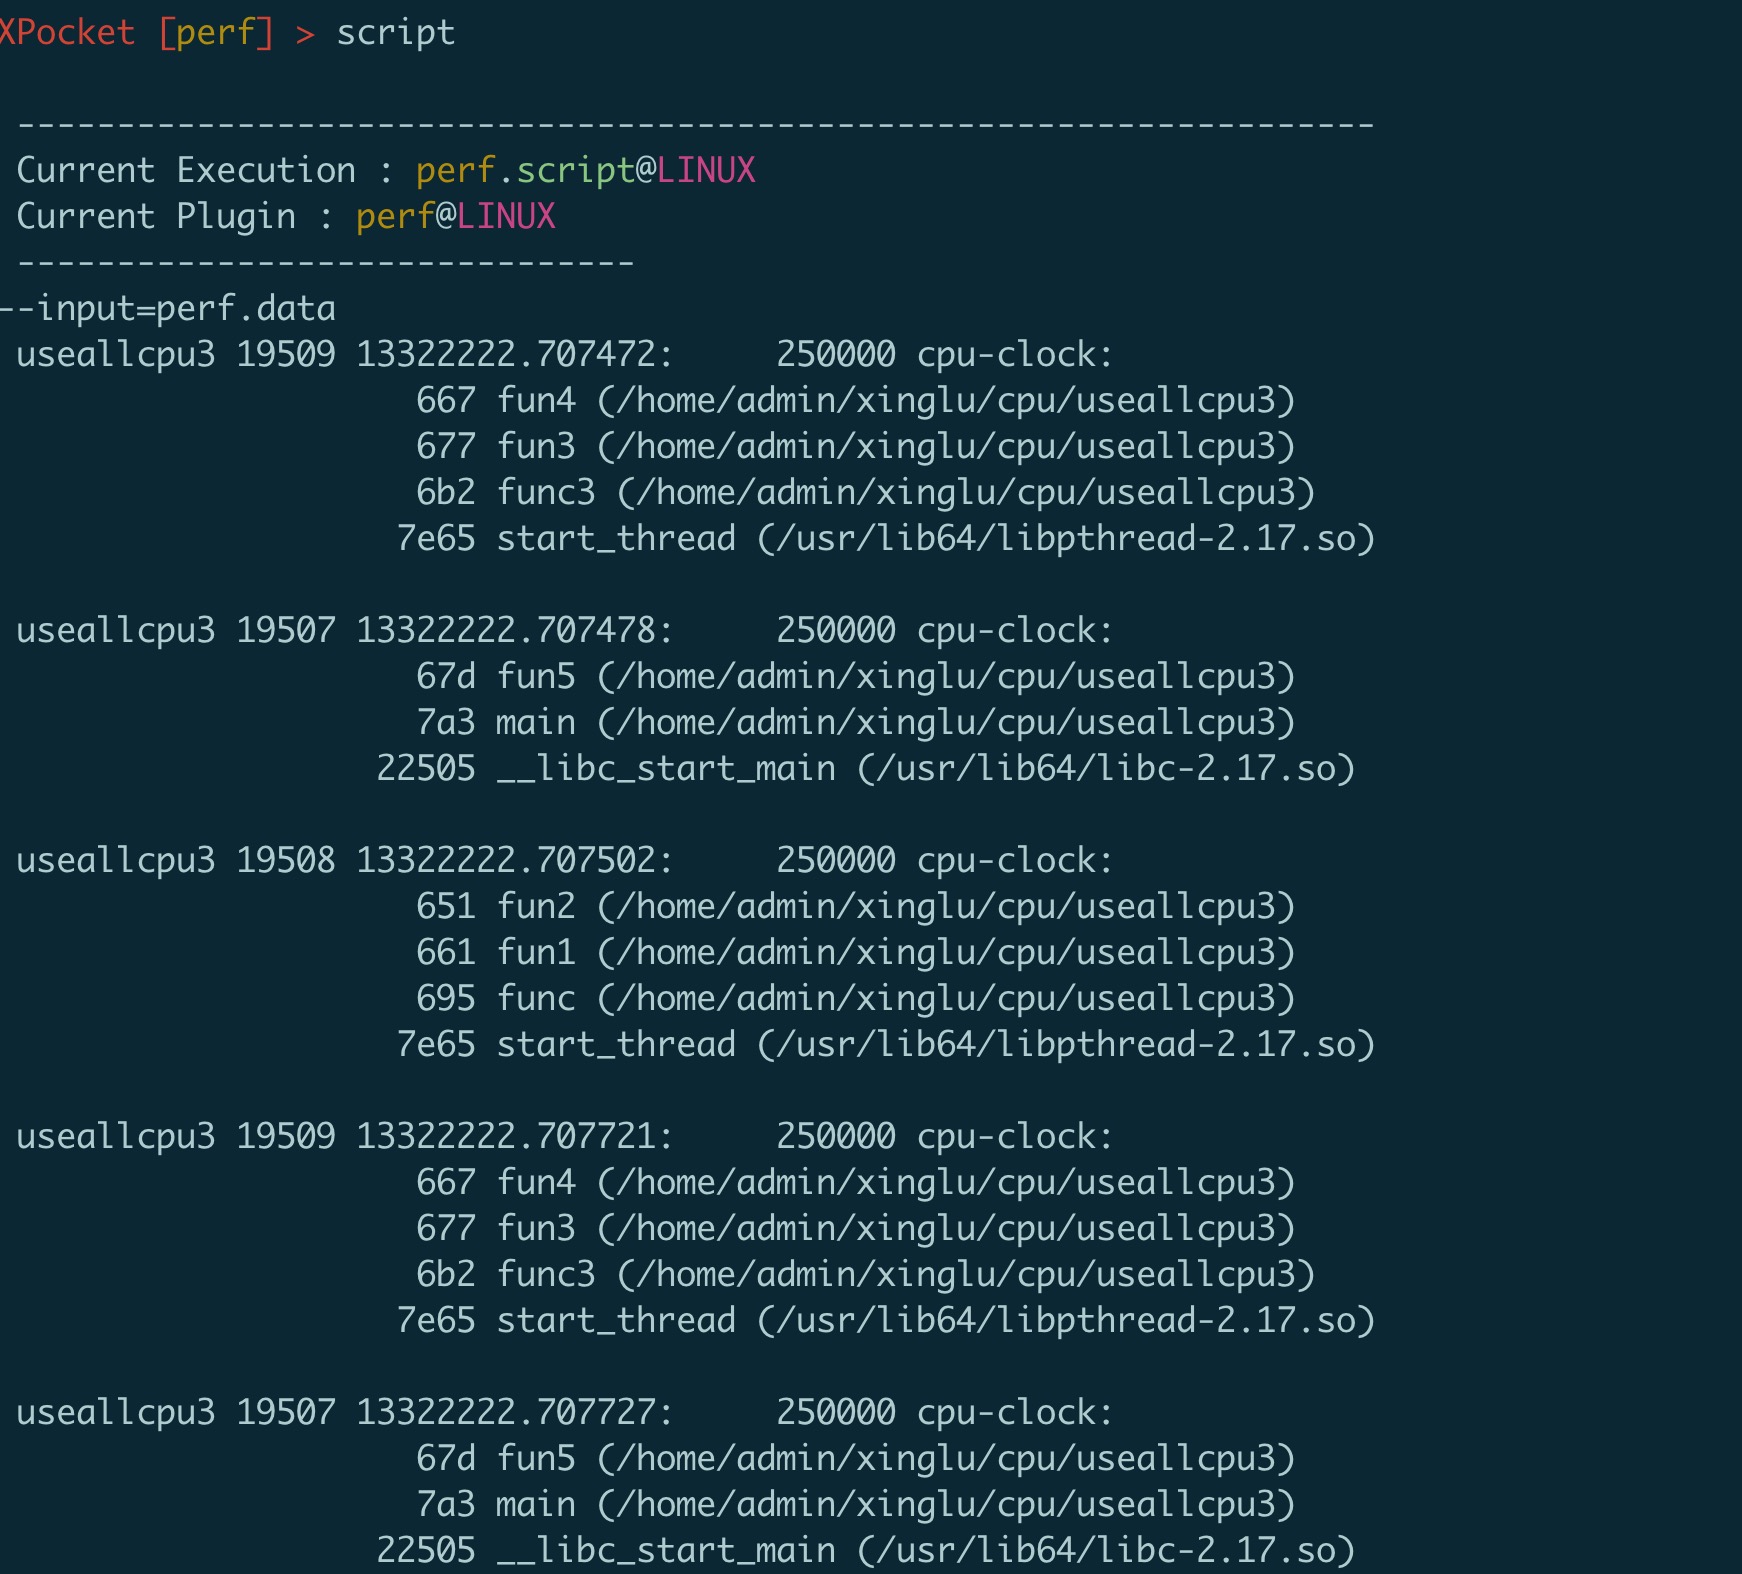
上图抓取进程 19507的cpu热点共抓到25549条数据,我们可以通过script命令看一下抓取到的数据大概是什么样子的
就是抓取的一条一条调用栈
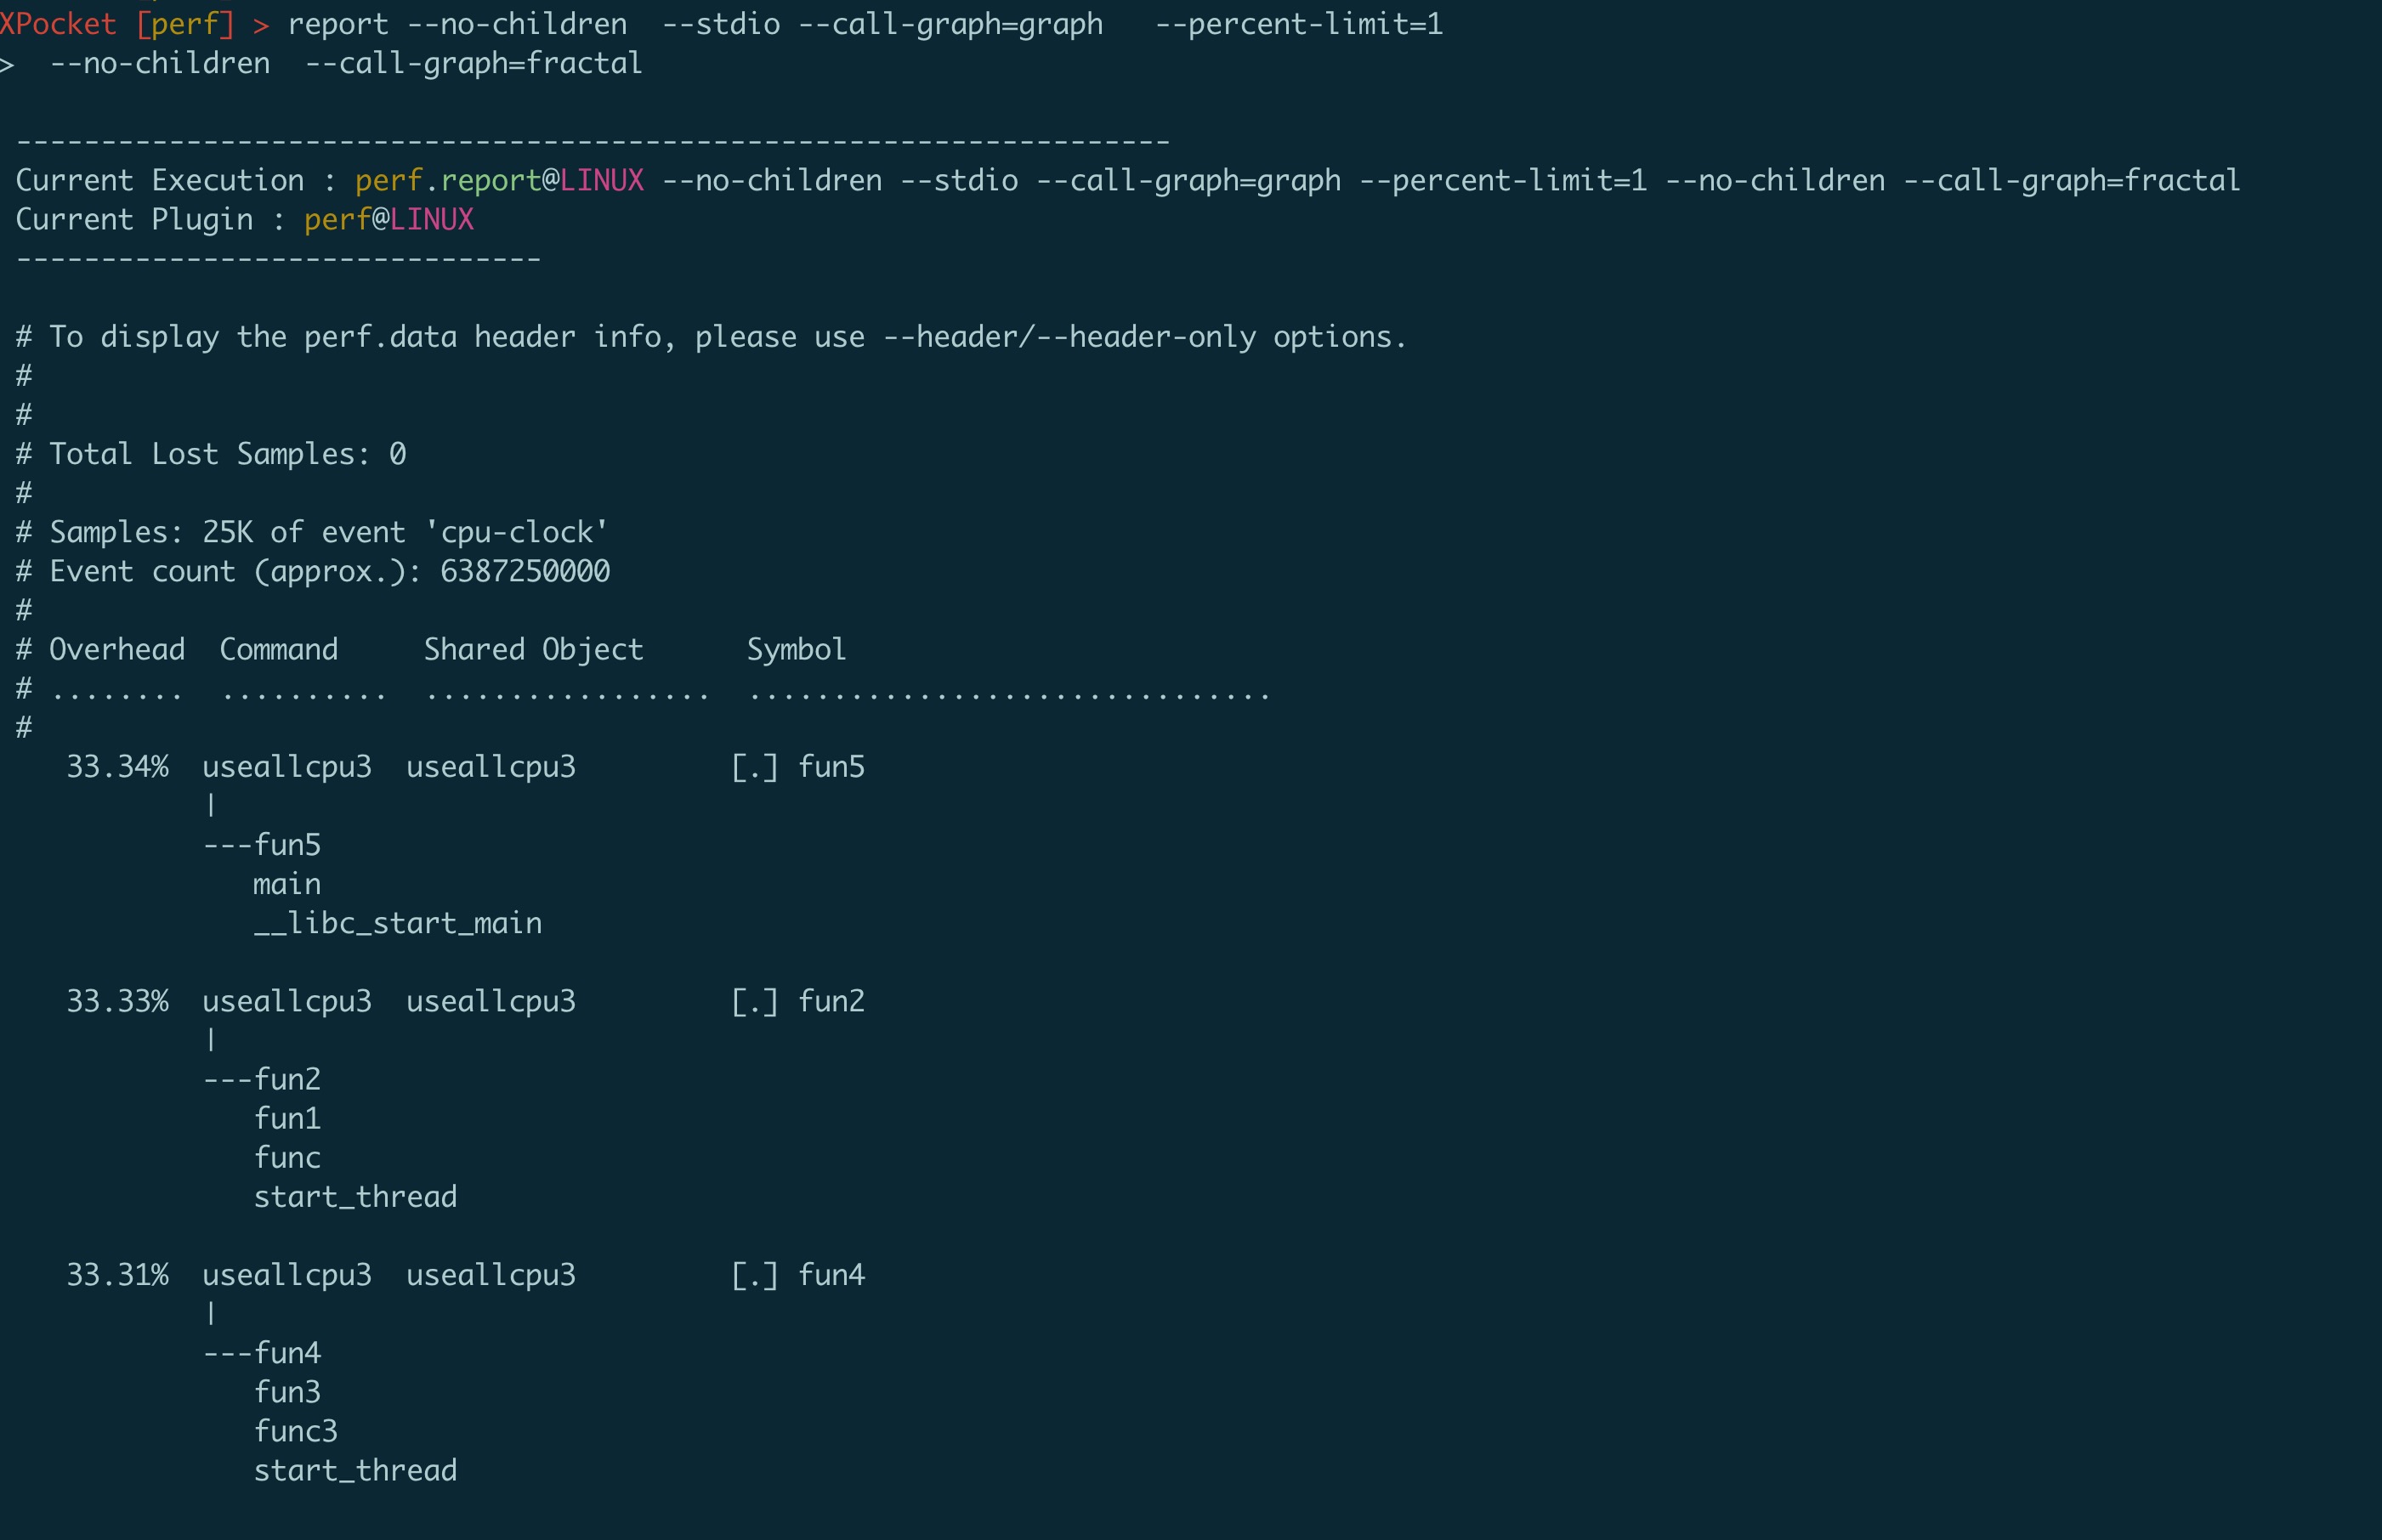
通过report命令对抓取到的调用栈进行下汇总和总结得出热点报告
可以看到调用栈和每个函数占用cpu百分比都清晰的展示了出来。