使用XPocket插件top_x 解决cpu高及 cpu_load高的一般思路原创
本文使用了xpocket工具包的插件链接
xpocket地址:https://plugin.xpocket.perfma.com
top_x地址: https://plugin.xpocket.perfma.com/plugin/65
cpu使用率高是比较常见的性能问题,本文主要讲解cpu高及cpu_load高的一般解决思路,首先通过一段程序占用cpu,程序代码如下:
#include <pthread.h>
const int num = 2;
int fun2()
{
while(1) {}
}
int fun1()
{
fun2();
}
void *func(void* arg) {
fun1();
return ((void *)0);
}
int main(int argc, char* argv[]) {
int i,j;
pthread_t threads[num];
for ( i = 0; i < num; i++) {
pthread_create(&threads[i], NULL, func, NULL);
}
for (i = 0; i < num; i++) {
pthread_join(threads[i], NULL);
}
return 0;
}
该程序创建了两个线程执行while(1), 主线程则什么都不做
// main
// / \ \
// thread1 thread2 maninthread(do nothing)
// / \
// func func
// / \
// fun1 fun1
// / \
// fun2 fun2
gcc 编译和运行. 使用xpocket中的top_x插件看下当前的cpu使用情况:
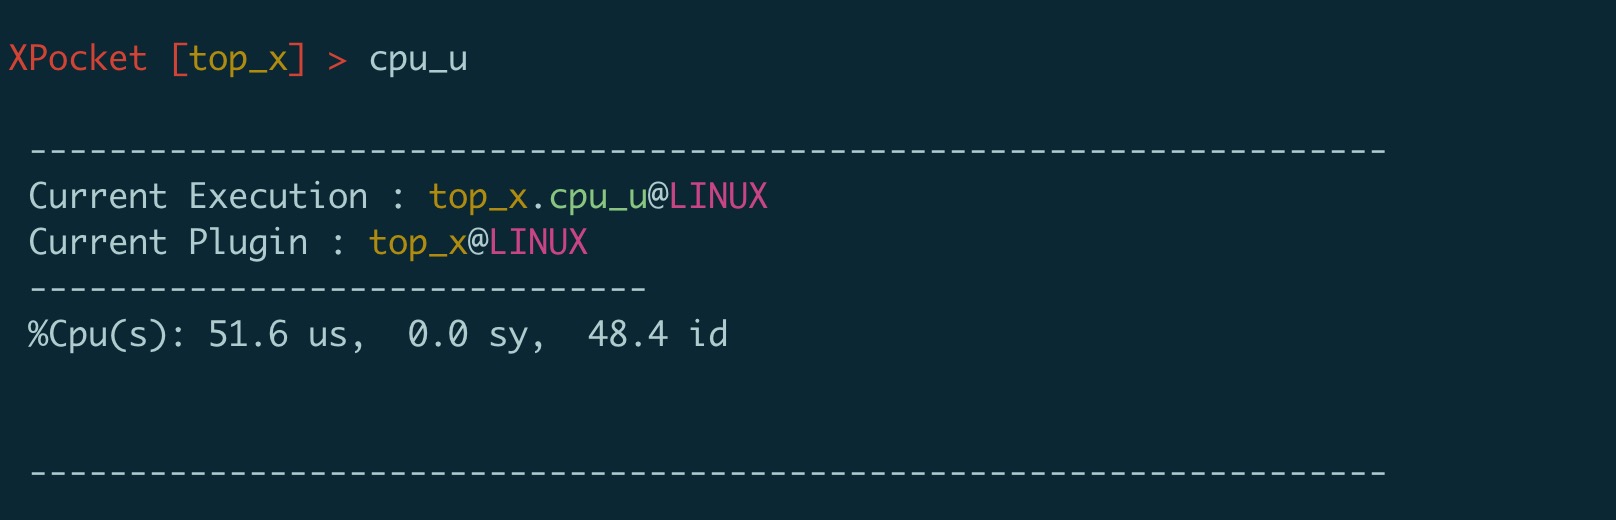
可以看到当前系统的 cpu被使用了51%多,因为当前测试机有4个核,正好符合上面测试程序的cpu占用情况,其中user态占用cpu比较高,sys态的cpu使用率很低,说明有用户进程进行了消耗cpu比较计算,如果反过来sys比较高的话说明内核在消耗cpu,sys占用cpu高的情况一般多样和复杂本文暂时不做讨论。
在发现某些进程占用cpu比较高时,可以使用top_x的 cpu_t命令,该命令会自动获取当前cpu占用最高进程的cpu情况,也可以通过-p参数指定进程pid. 直接使用cpu_t可以看到:
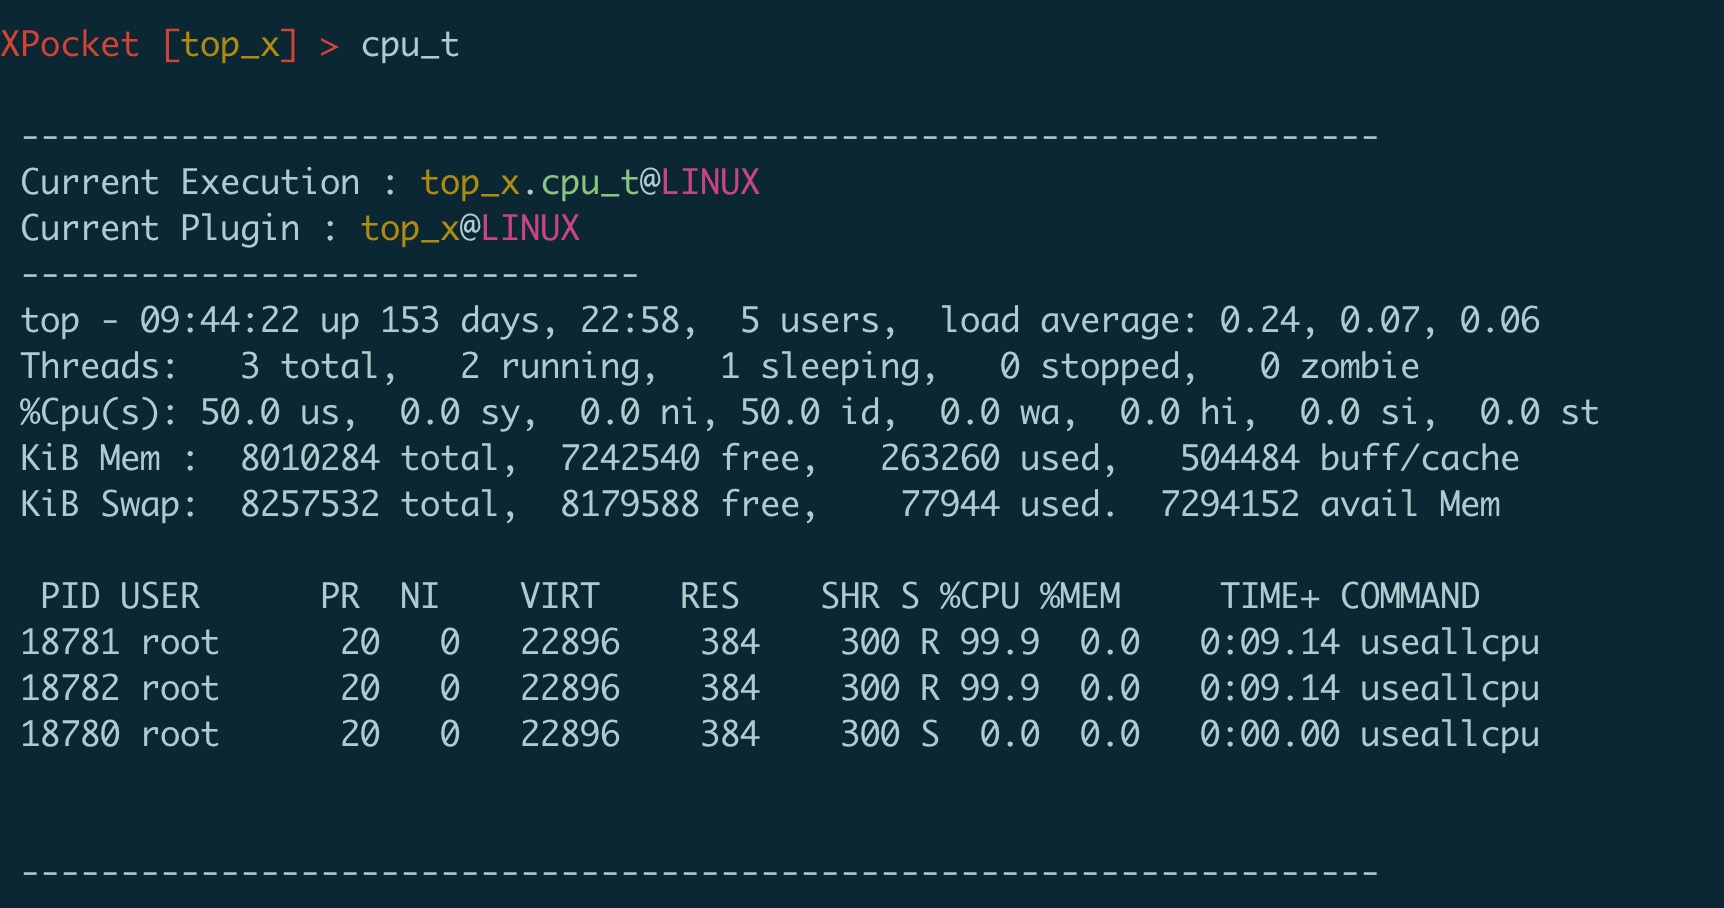
当前占用cpu高的最进程包含三个线程,其中有两个线程各使用了一个核的cpu,另外一个线程没有使用任何的cpu。
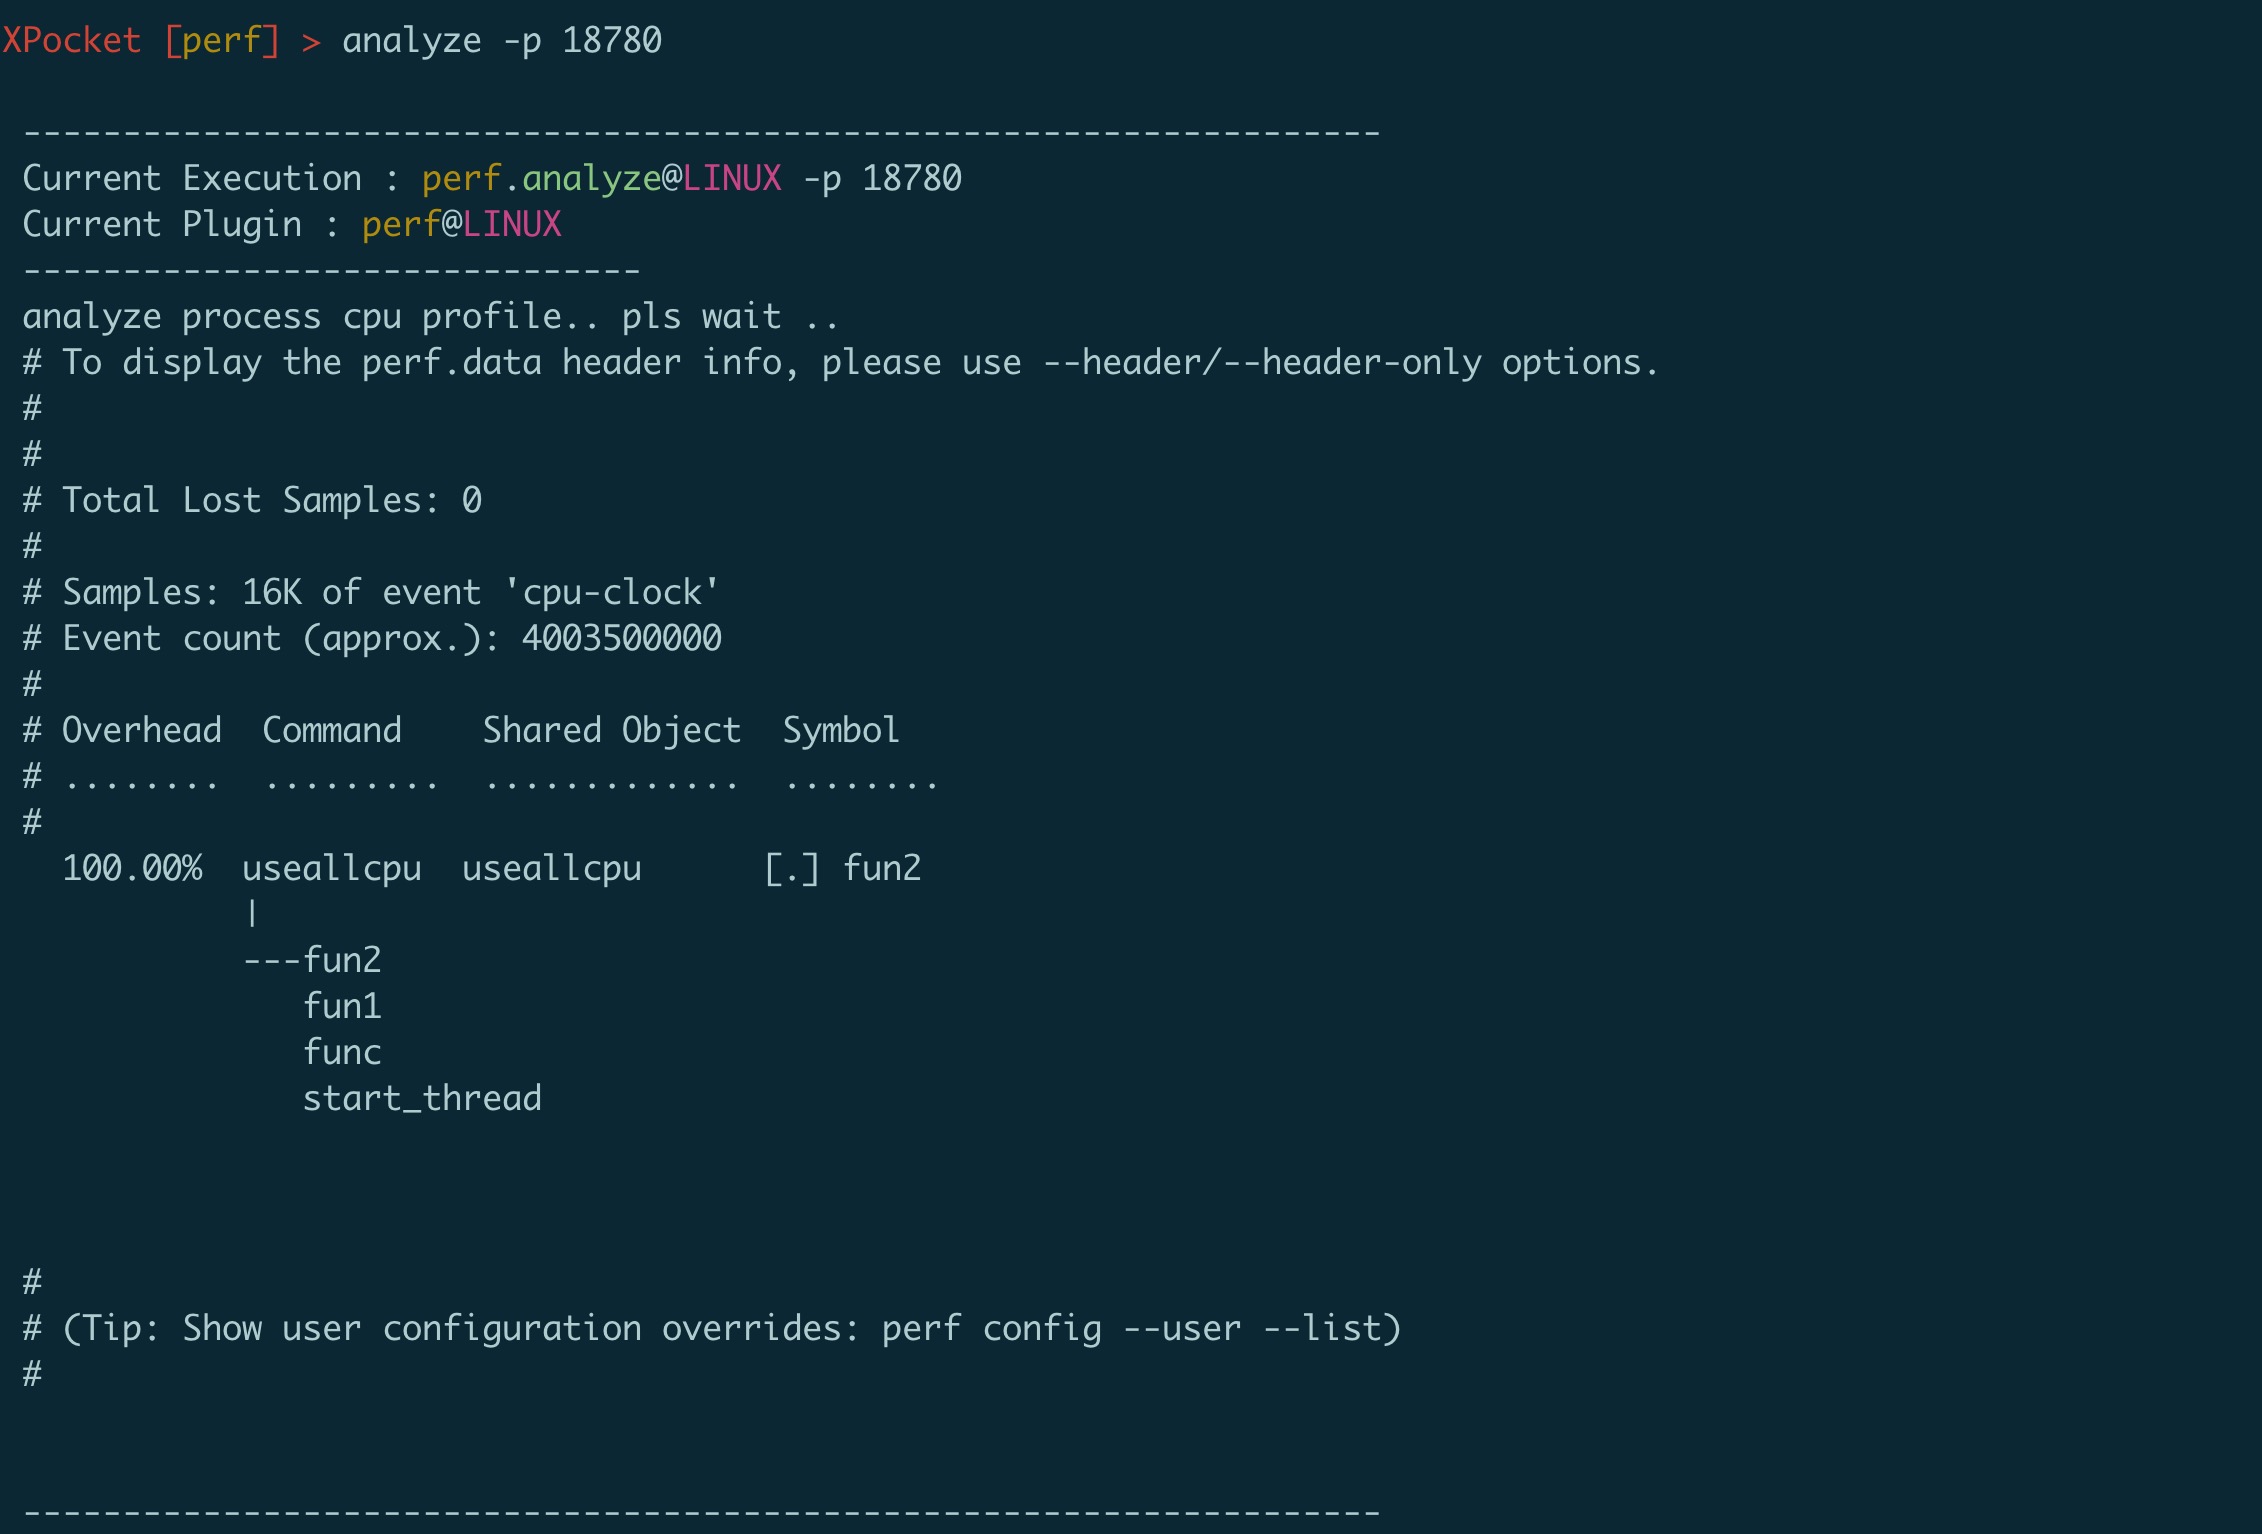
怎么查看是哪些函数占用cpu比较高呢, 对于c/c++程序可以使用perf来做到这一点,xpocket同样的把perf工具集成了进来,使用perf插件中的 analyze 命令抓一下cpu 热点函数:
可以看到热点函数采样中fun2占了100%的数量,用户同样可以使用record 自定义cpu热点采样参数比如采样频率等等。
cpu_load 和 cpu 使用率是两个维度,cpu_load 表示系统的负载情况,其计算原理依赖当前系统中处于running 状态的 process 数量,running 状态包含真正处于运行状态的process 和 uninterruptible sleep下的process, 一般进程或线程读磁盘的时会进入到uninterruptible sleep状态,其实在uninterruptible sleep状态下进程是不占用cpu的但是cpu_load会把这种状态的进程算进去,看看cpu_load作者怎么回答的吧
"The point of "load average" is to arrive at a number relating how busy the system is from a
human point of view.
TASK_UNINTERRUPTIBLE means (meant?) that the process is waiting for something like a disk read
which contributes to system load.
A heavily disk-bound system might be extremely sluggish but only have a TASK_RUNNING average of 0.1,
which doesn't help anybody."
使用top_x也可以很简单的看一下cpu_load负载情况和哪些进程导致cpu_load高,我们通过上面的程序和fio测试工具来模拟一下cpu_load过高的情况
./fio -filename=/home/admin/xinglu/fiotest/testfile -direct=1 -rw=randread -bs=8k
-size=1G-numjobs=16 -runtime=60 -group_reporting -name=fio_test
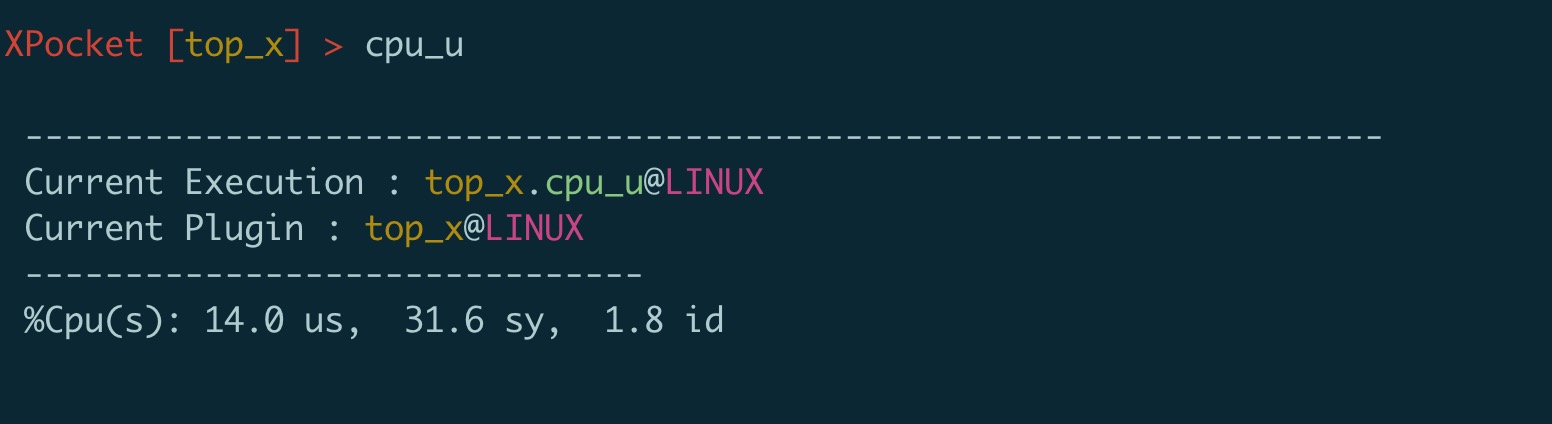
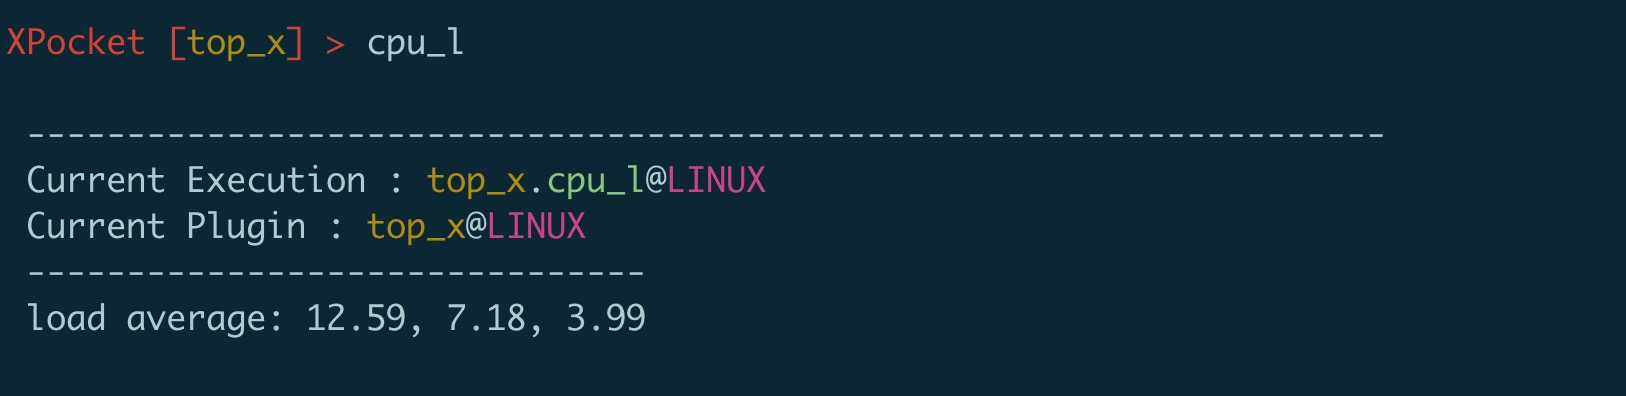
在程序运行时查看cpu_load 和 cpu使用率
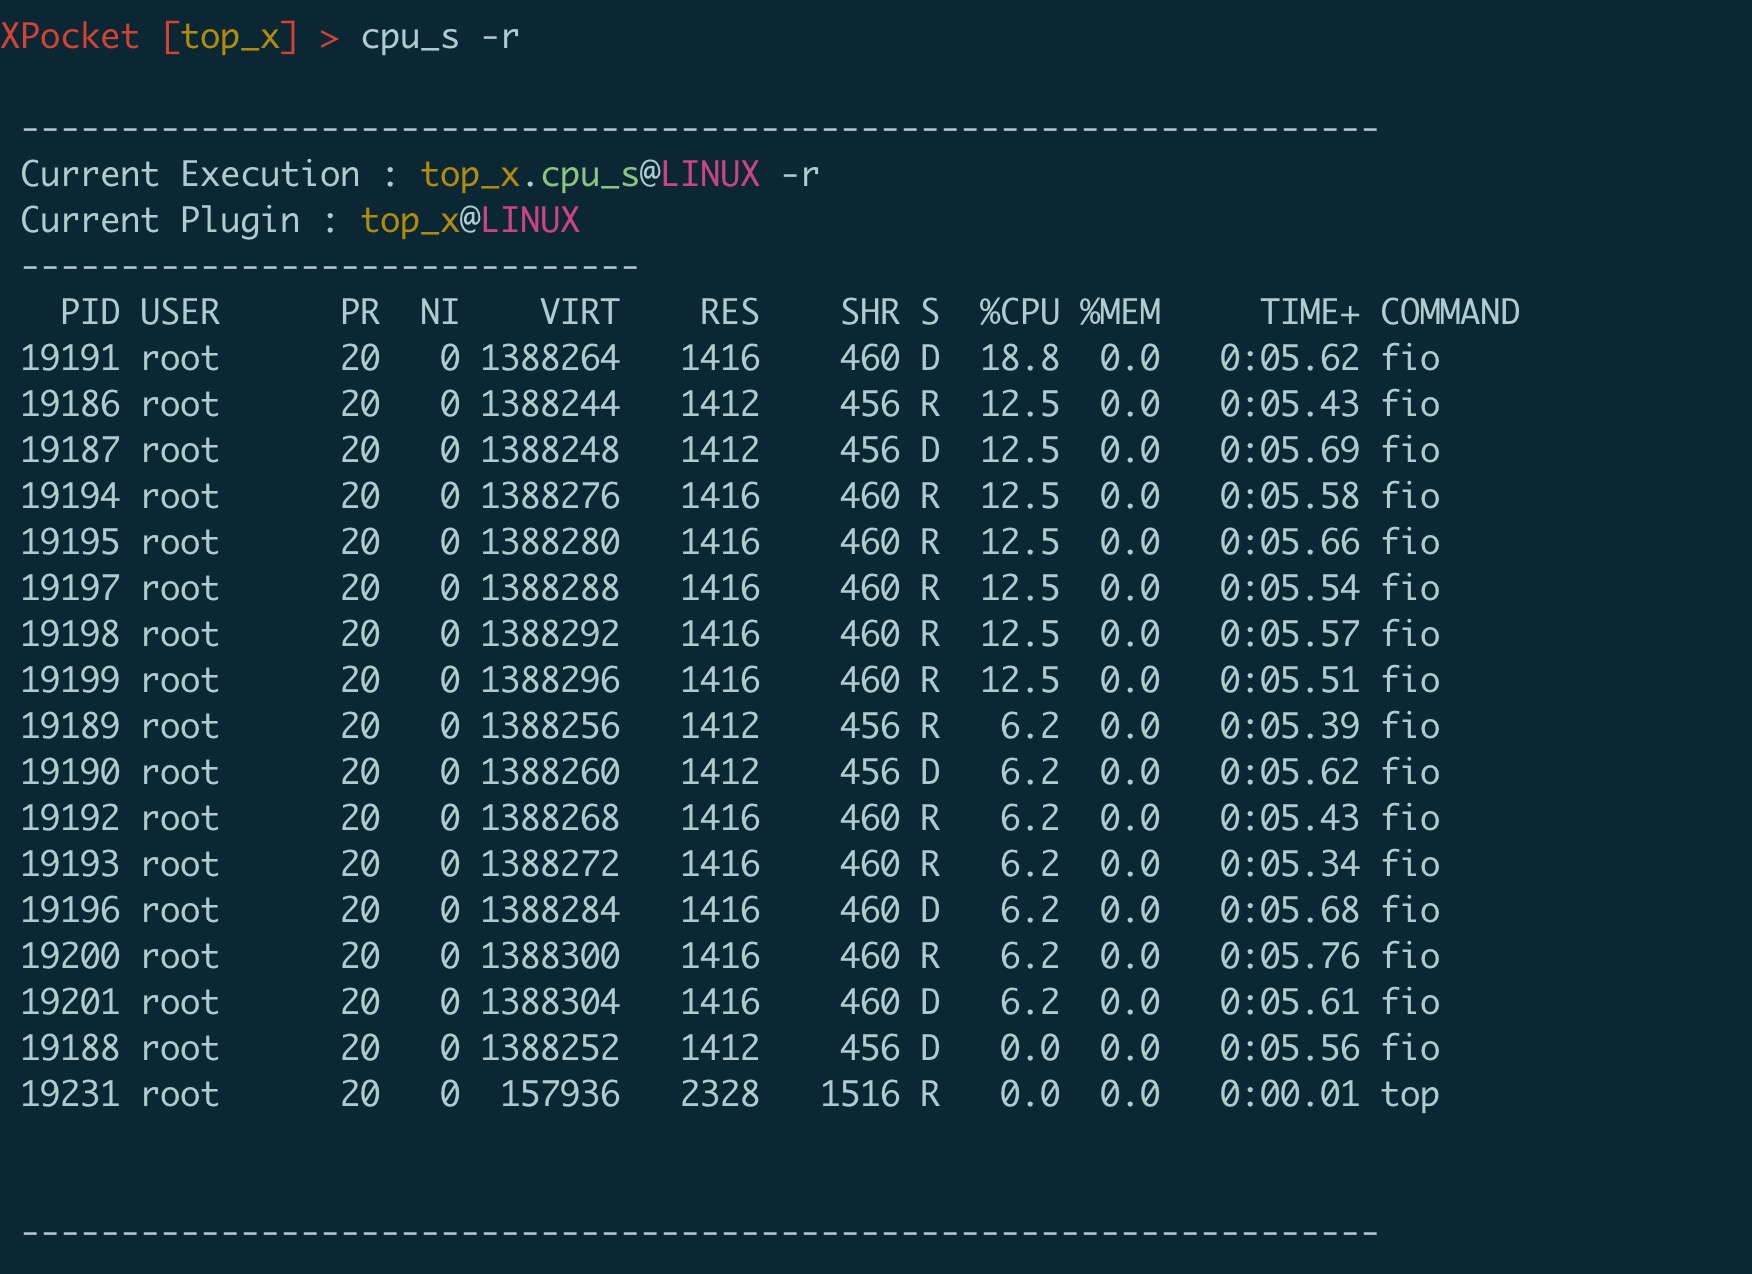
可以看到cpu使用率才14%左右,但是cpu_load已经高达12,通过cpu_s -r 查看哪些进程导致cpu_load过高
由上图可以看出fio有大量的R和D状态的proccess导致cpu_load飚高.
top_x插件针对linux原有top命令做了增强更加易用和简洁,可以方便的解决cpu一类的问题,欢迎大家使用并提出意见 :)